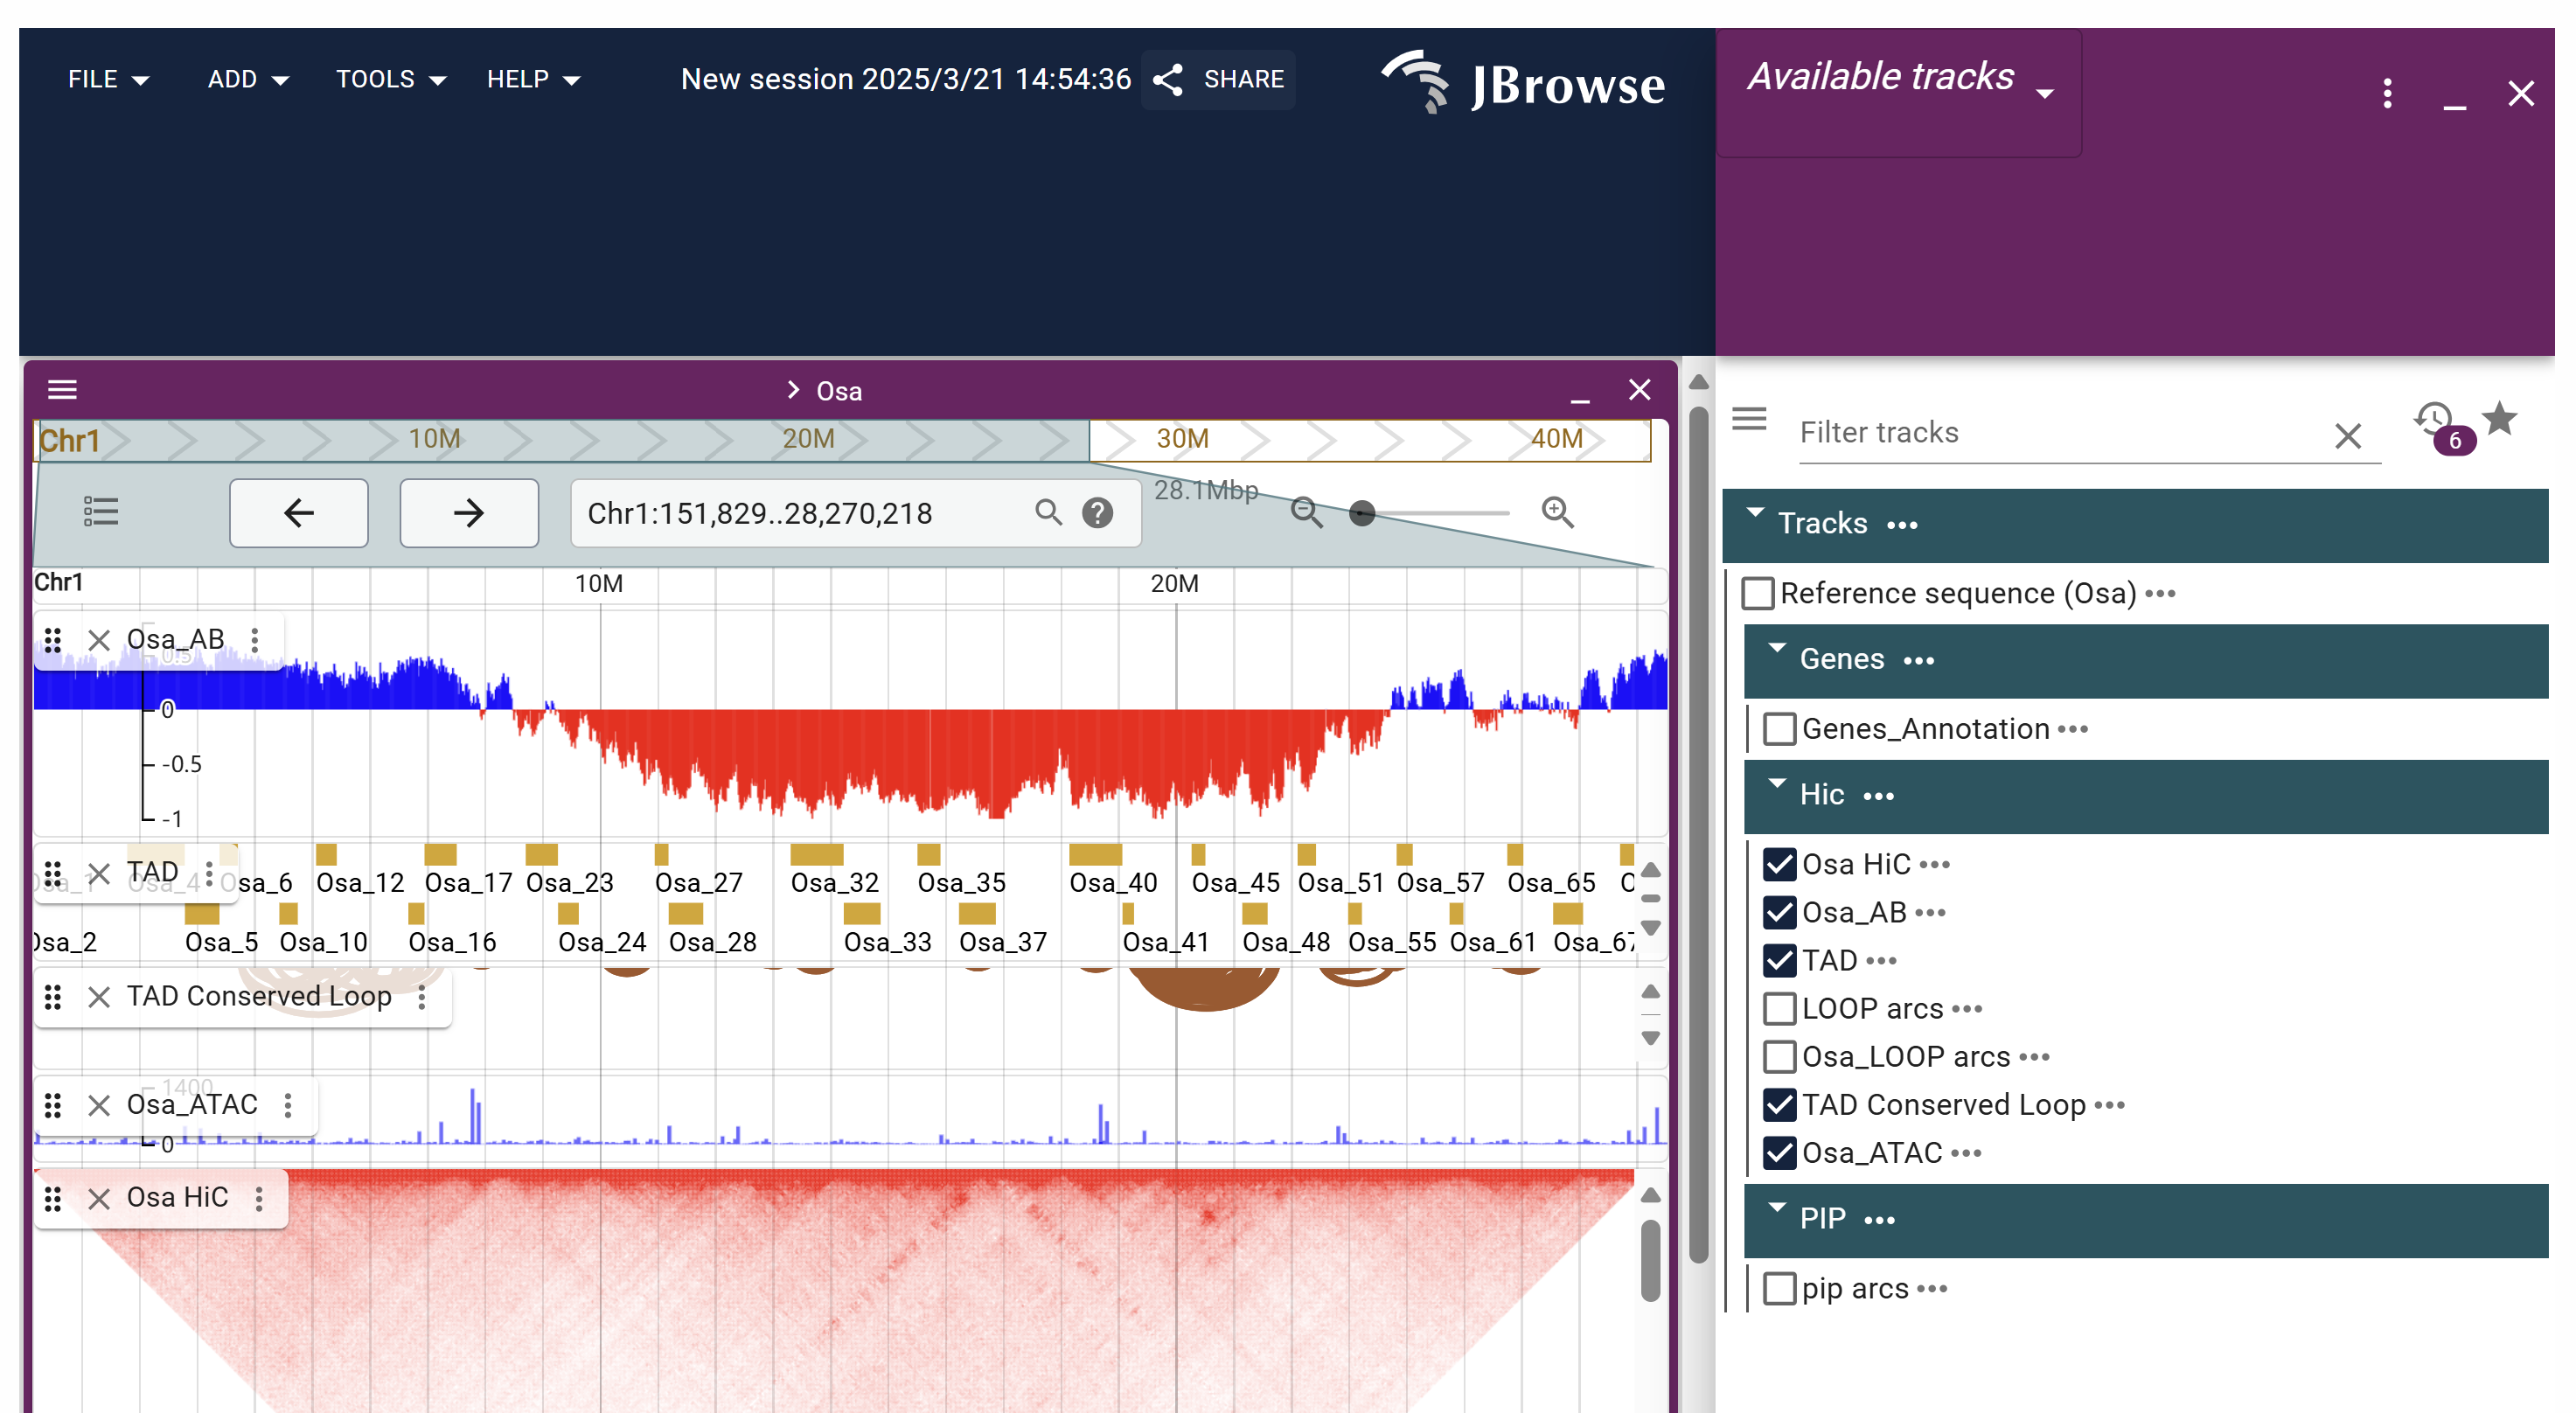
This view allows you to visualize genomic data in a linear format.
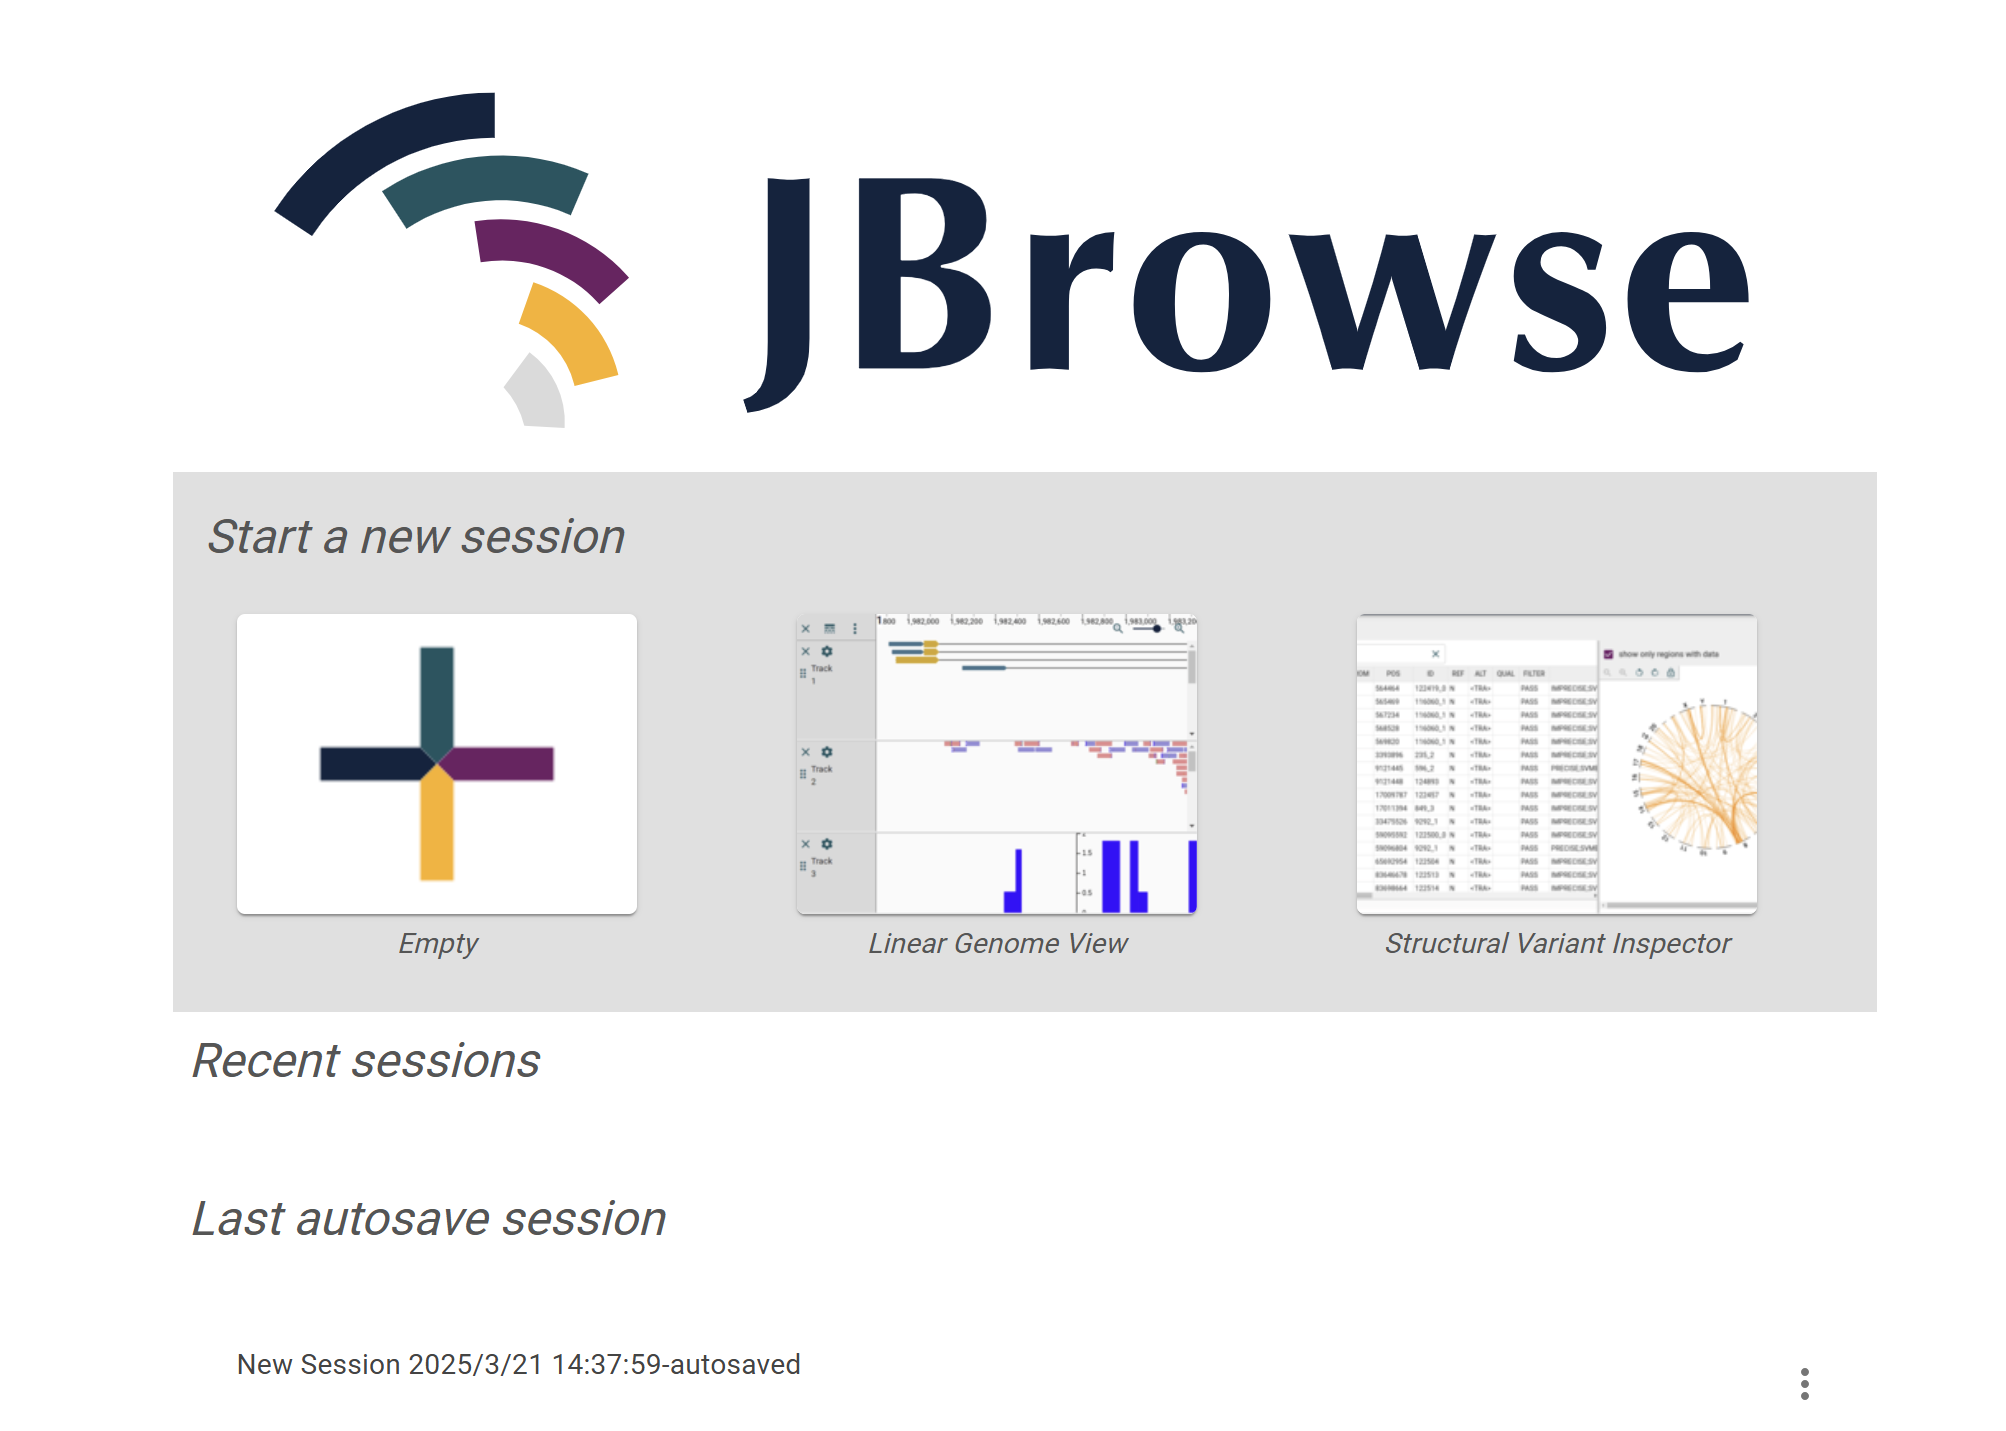
On the Species JBrowse page, users can view genomic sequences, gene annotation information, Hi-C data, protein interaction networks, and more by selecting the corresponding options. Additionally, the page supports uploading custom data (such as ATAC-seq, ChIP-seq, WGBS, etc.) for comprehensive analysis.
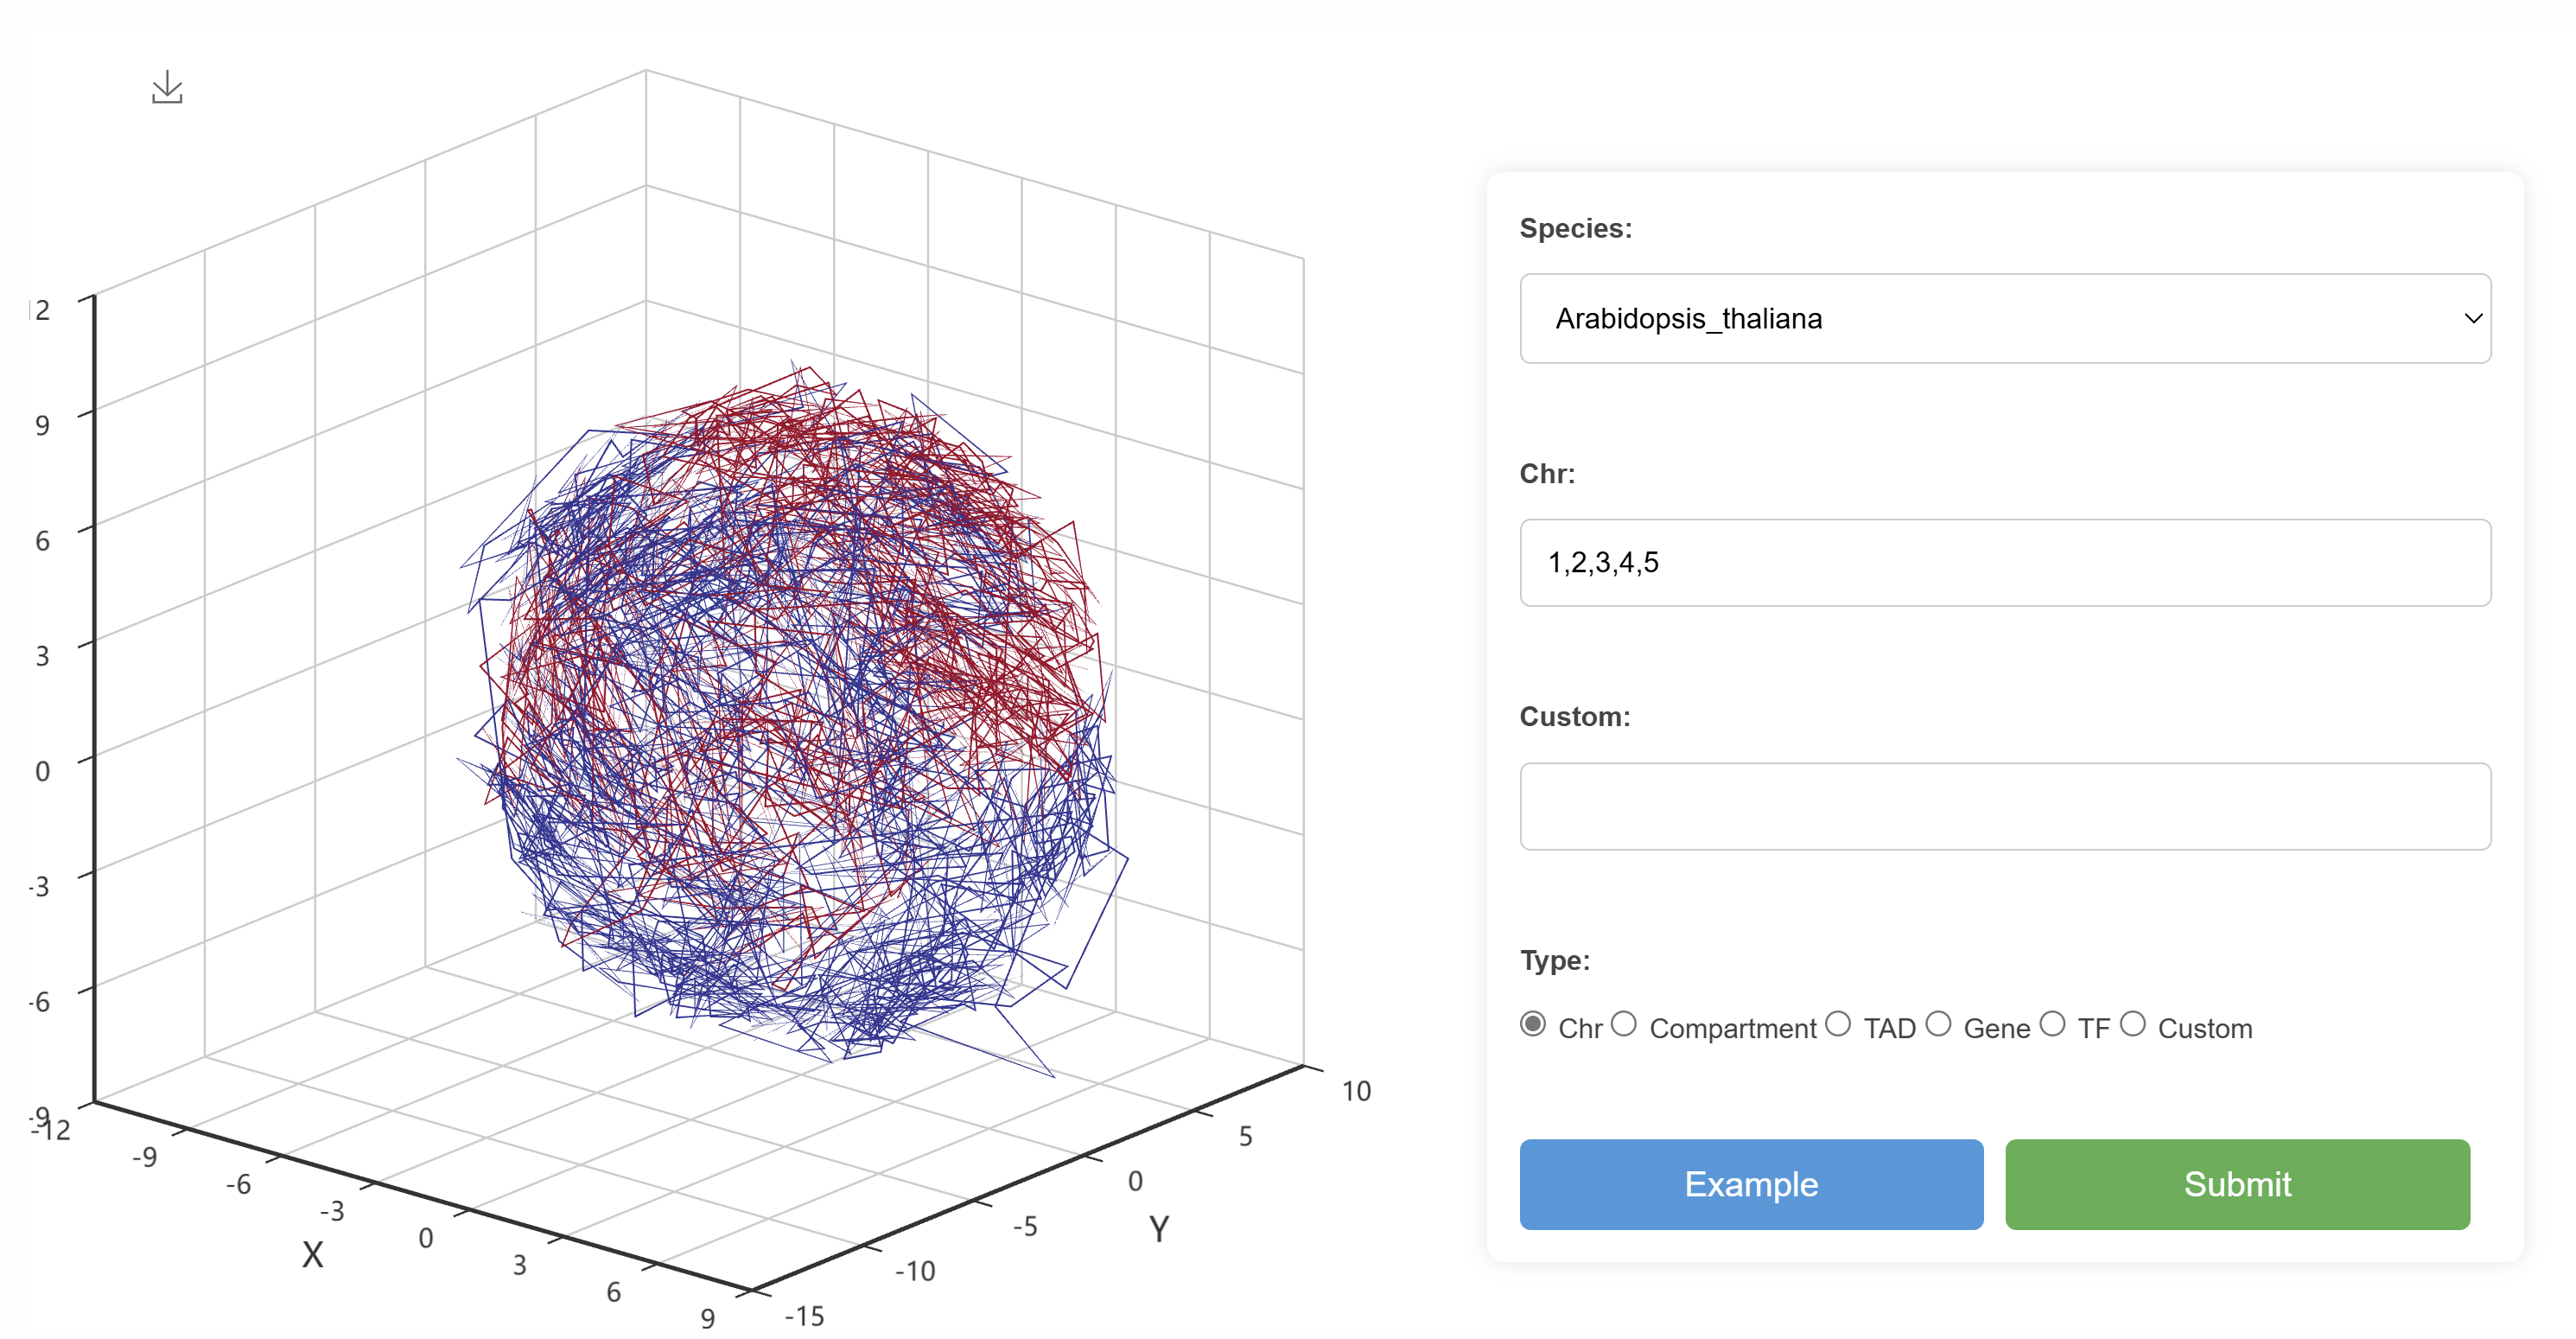
Users can select a species and specify a chromosome to view the structure of the selected chromosome. The visualization includes chromosome layout, compartments, TADs, GFF annotations, and transcription factors (TF).
Users can explore the compartment structure within a species by selecting a specific chromosome. This view allows for the visualization of gene collinearity and conserved compartment structures on the chosen chromosome.
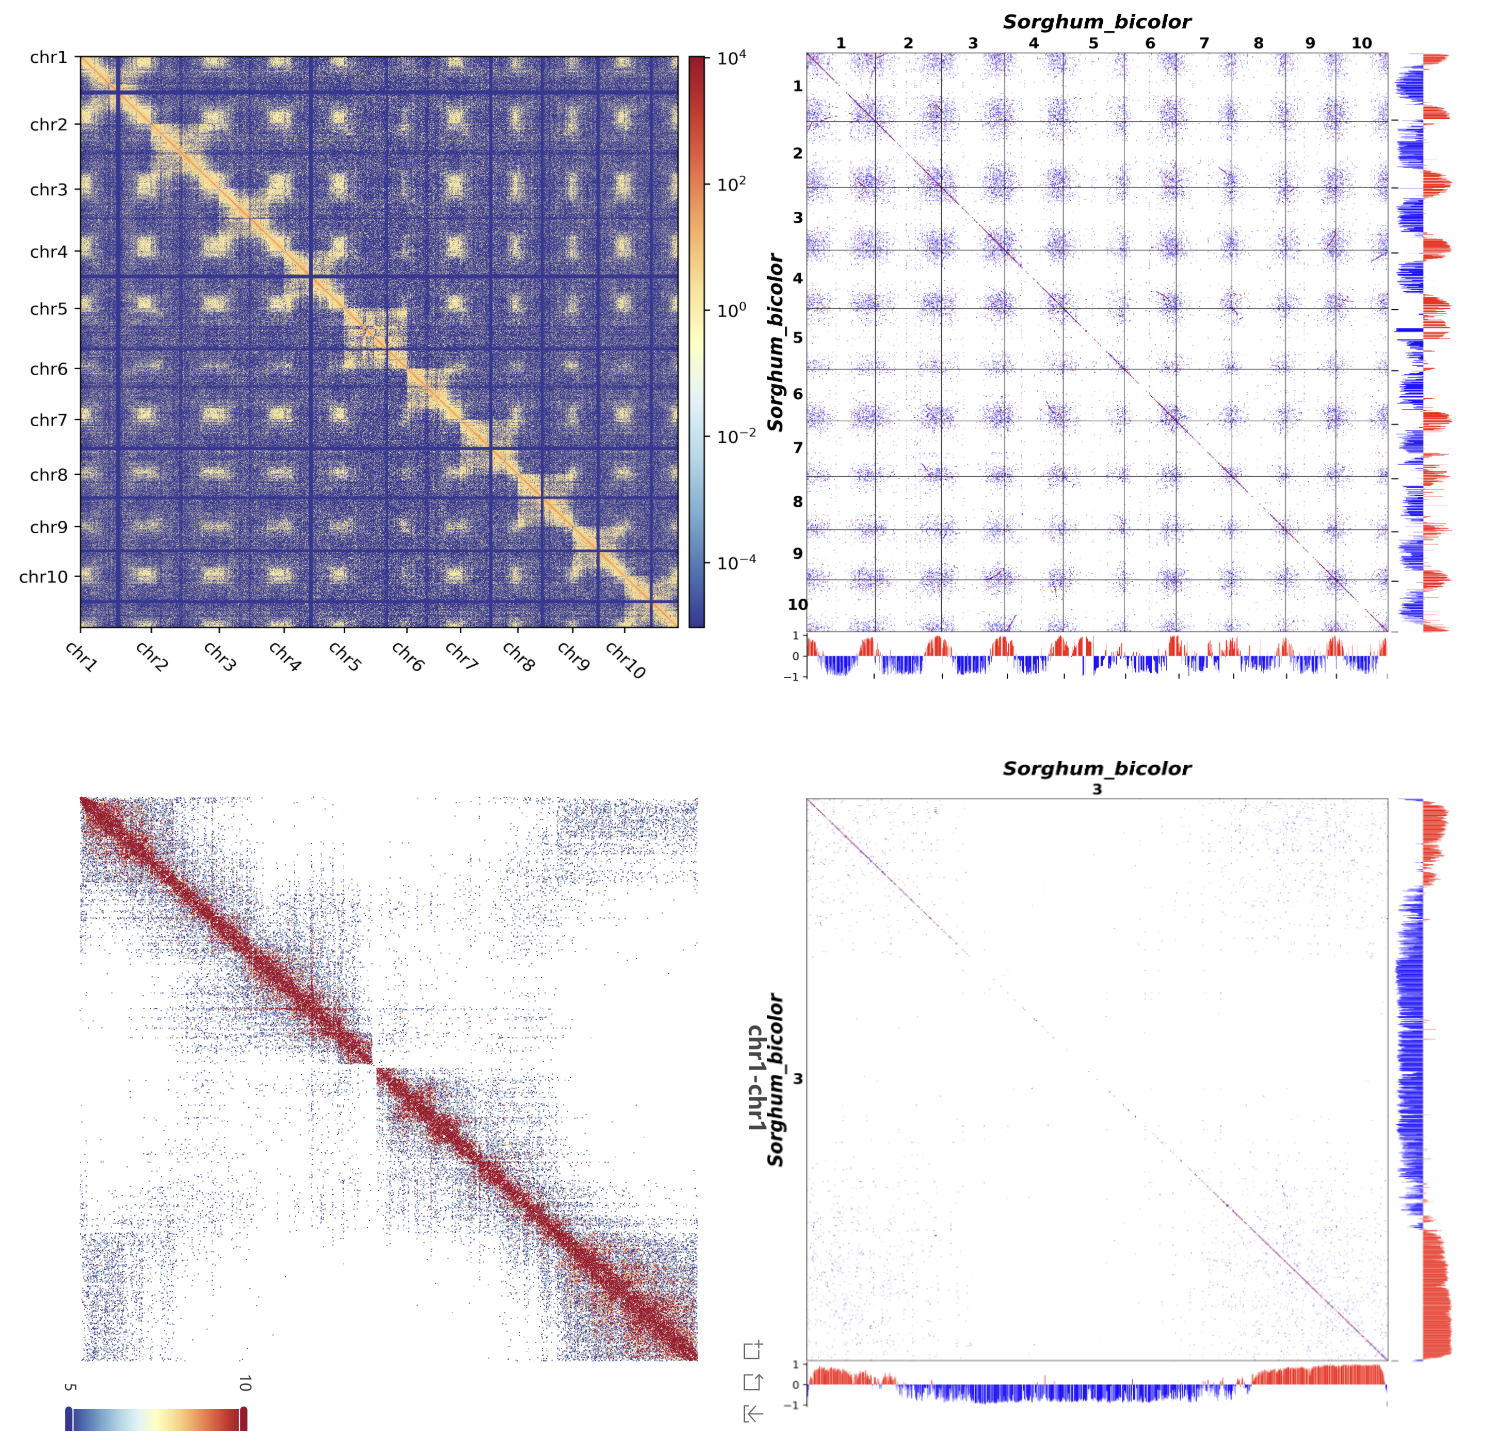
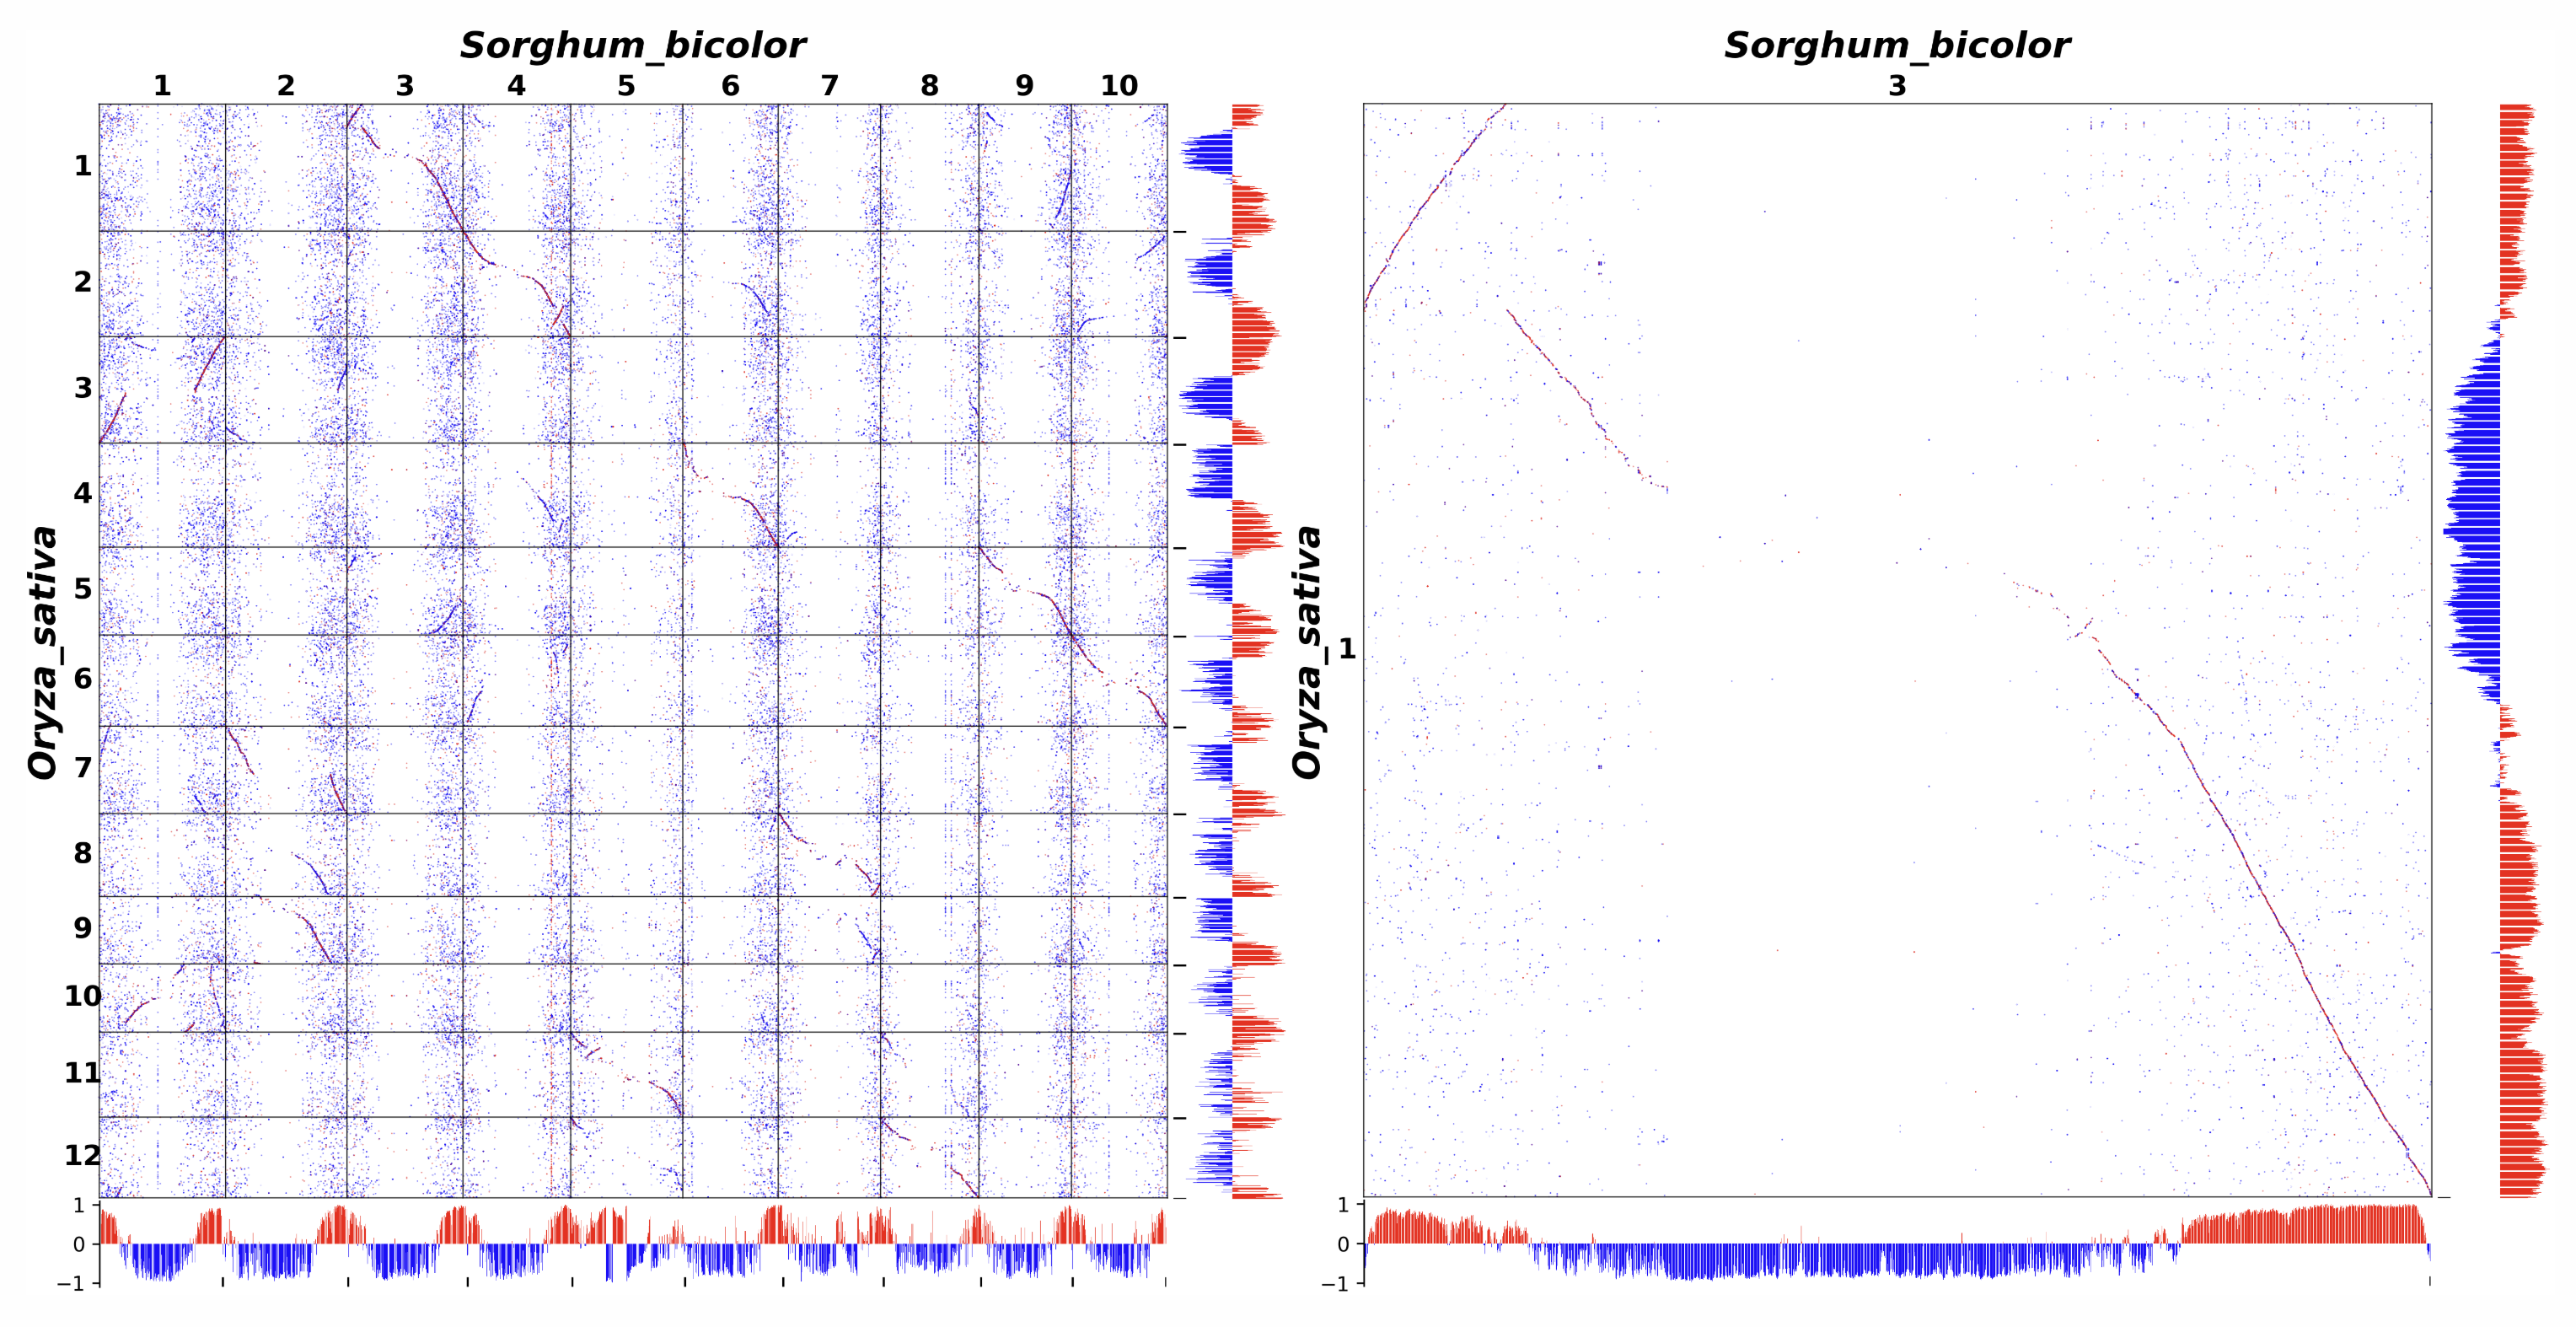
The page displays both whole-genome and single-chromosome Hi-C heatmaps combined with gene collinearity plots, integrating compartment information. The interactive Hi-C heatmap allows users to adjust the threshold to filter high-interaction regions for further analysis.
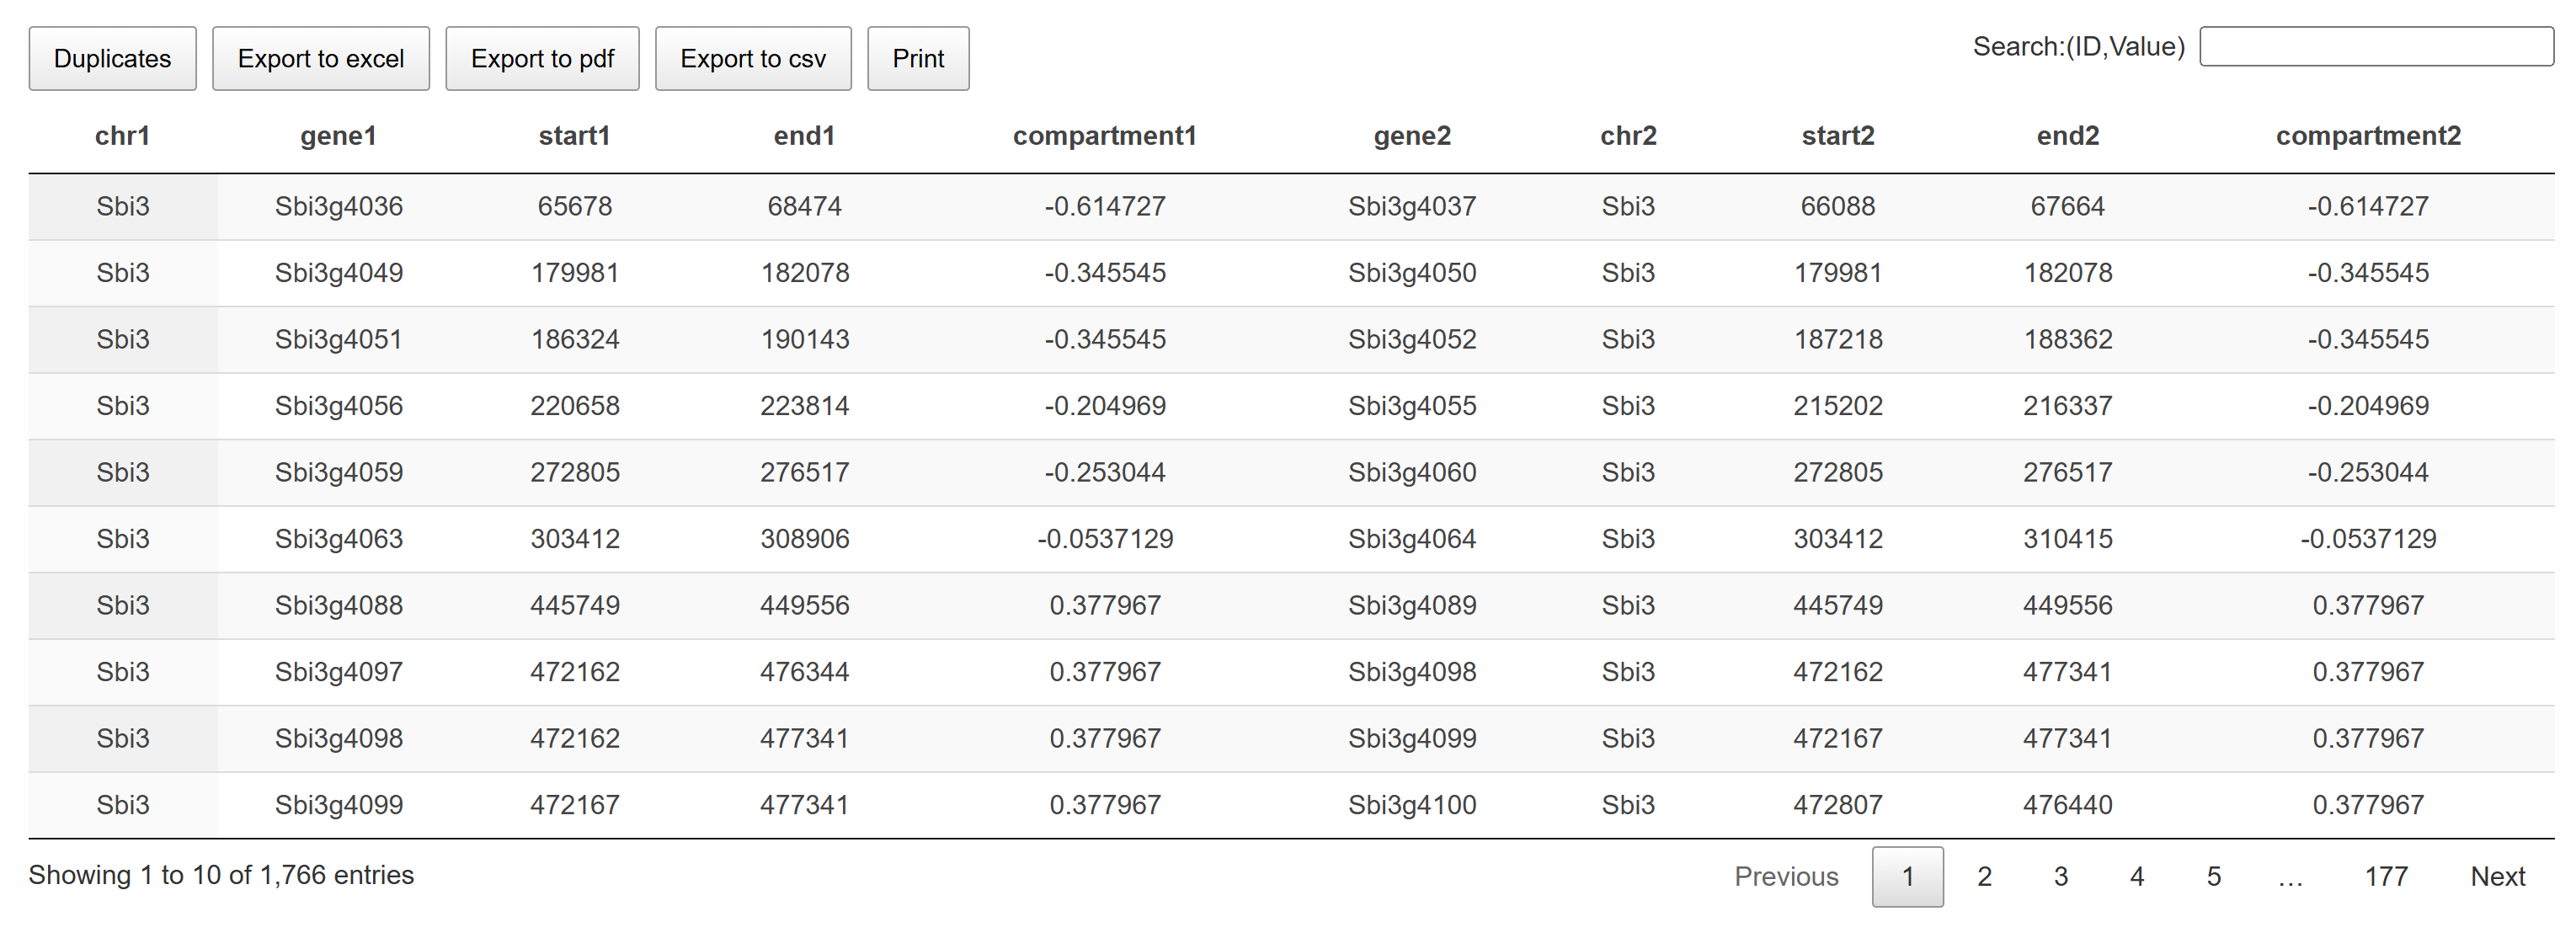
This page provides a collinear gene list integrated with compartment information, allowing users to examine paralogous genes within the same chromosome and their corresponding compartments. The interactive table supports search and query functions, and users can easily copy the content or export it as CSV or PDF files for download.
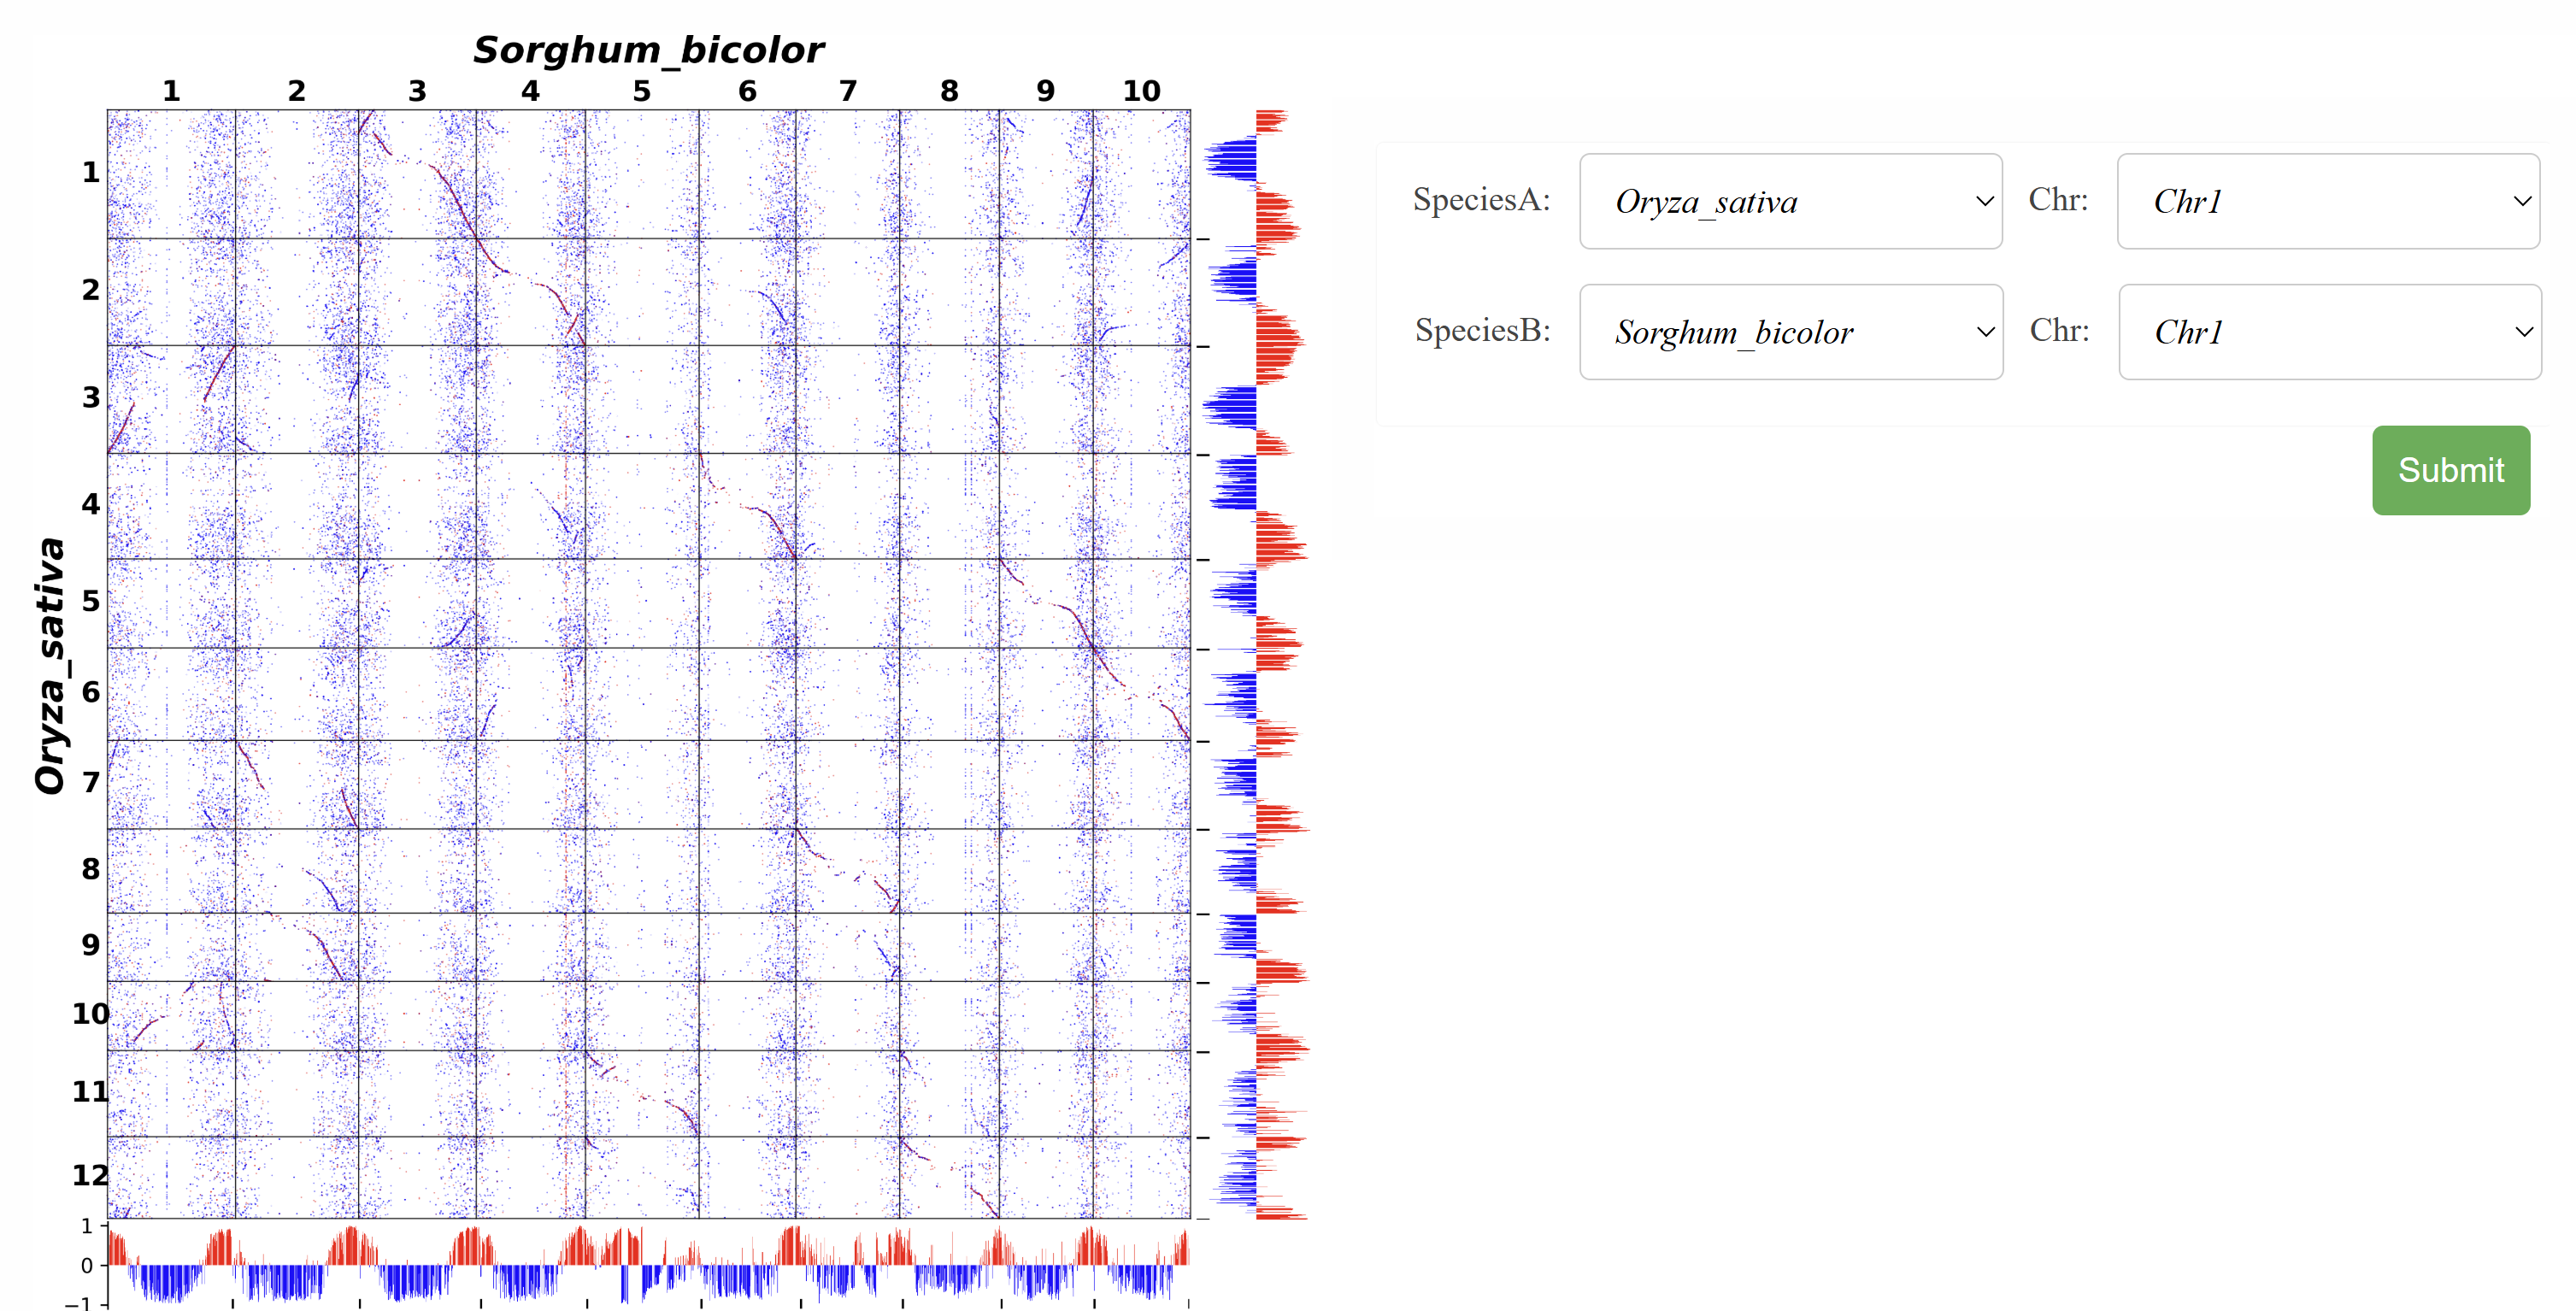
This page enables comparative analysis of compartments between different species. Users can select chromosomes from various species to analyze conserved structural features and identify compartment similarities and differences.
这里展示搜索量最高的物种排名,帮助你快速了解热门物种。
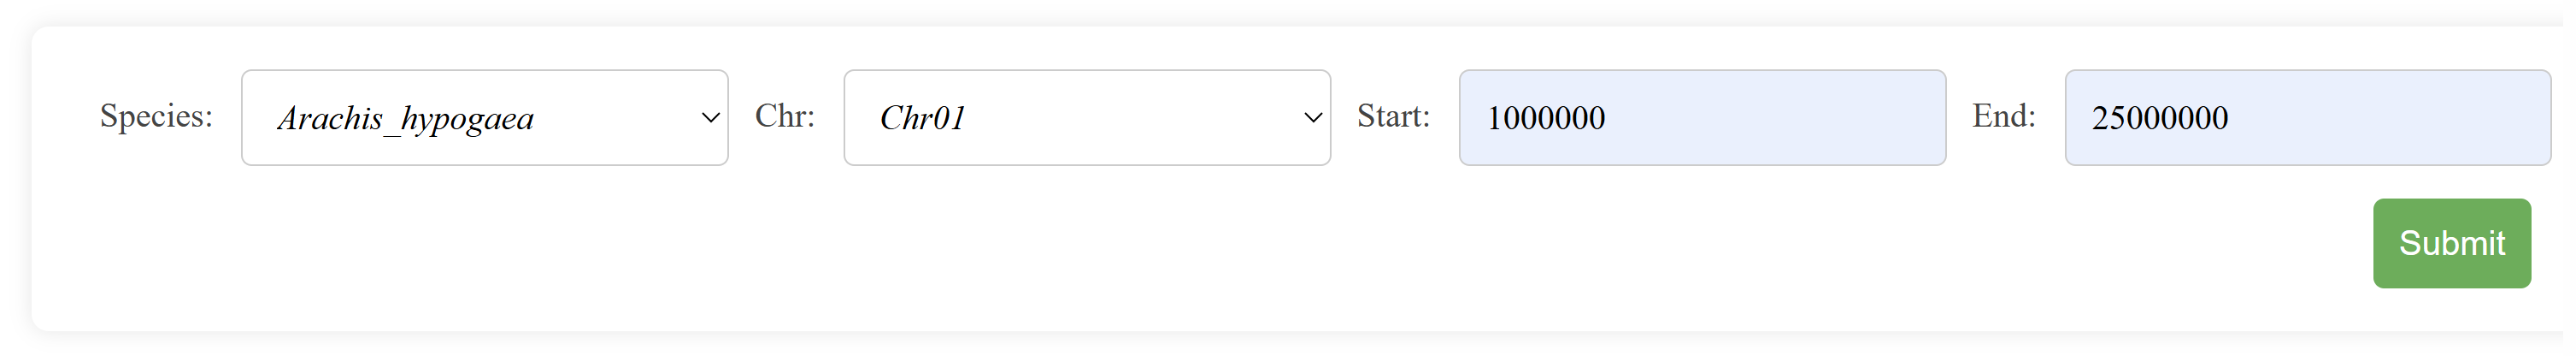
This page allows users to explore the TAD structure within a species by specifying a chromosome region.
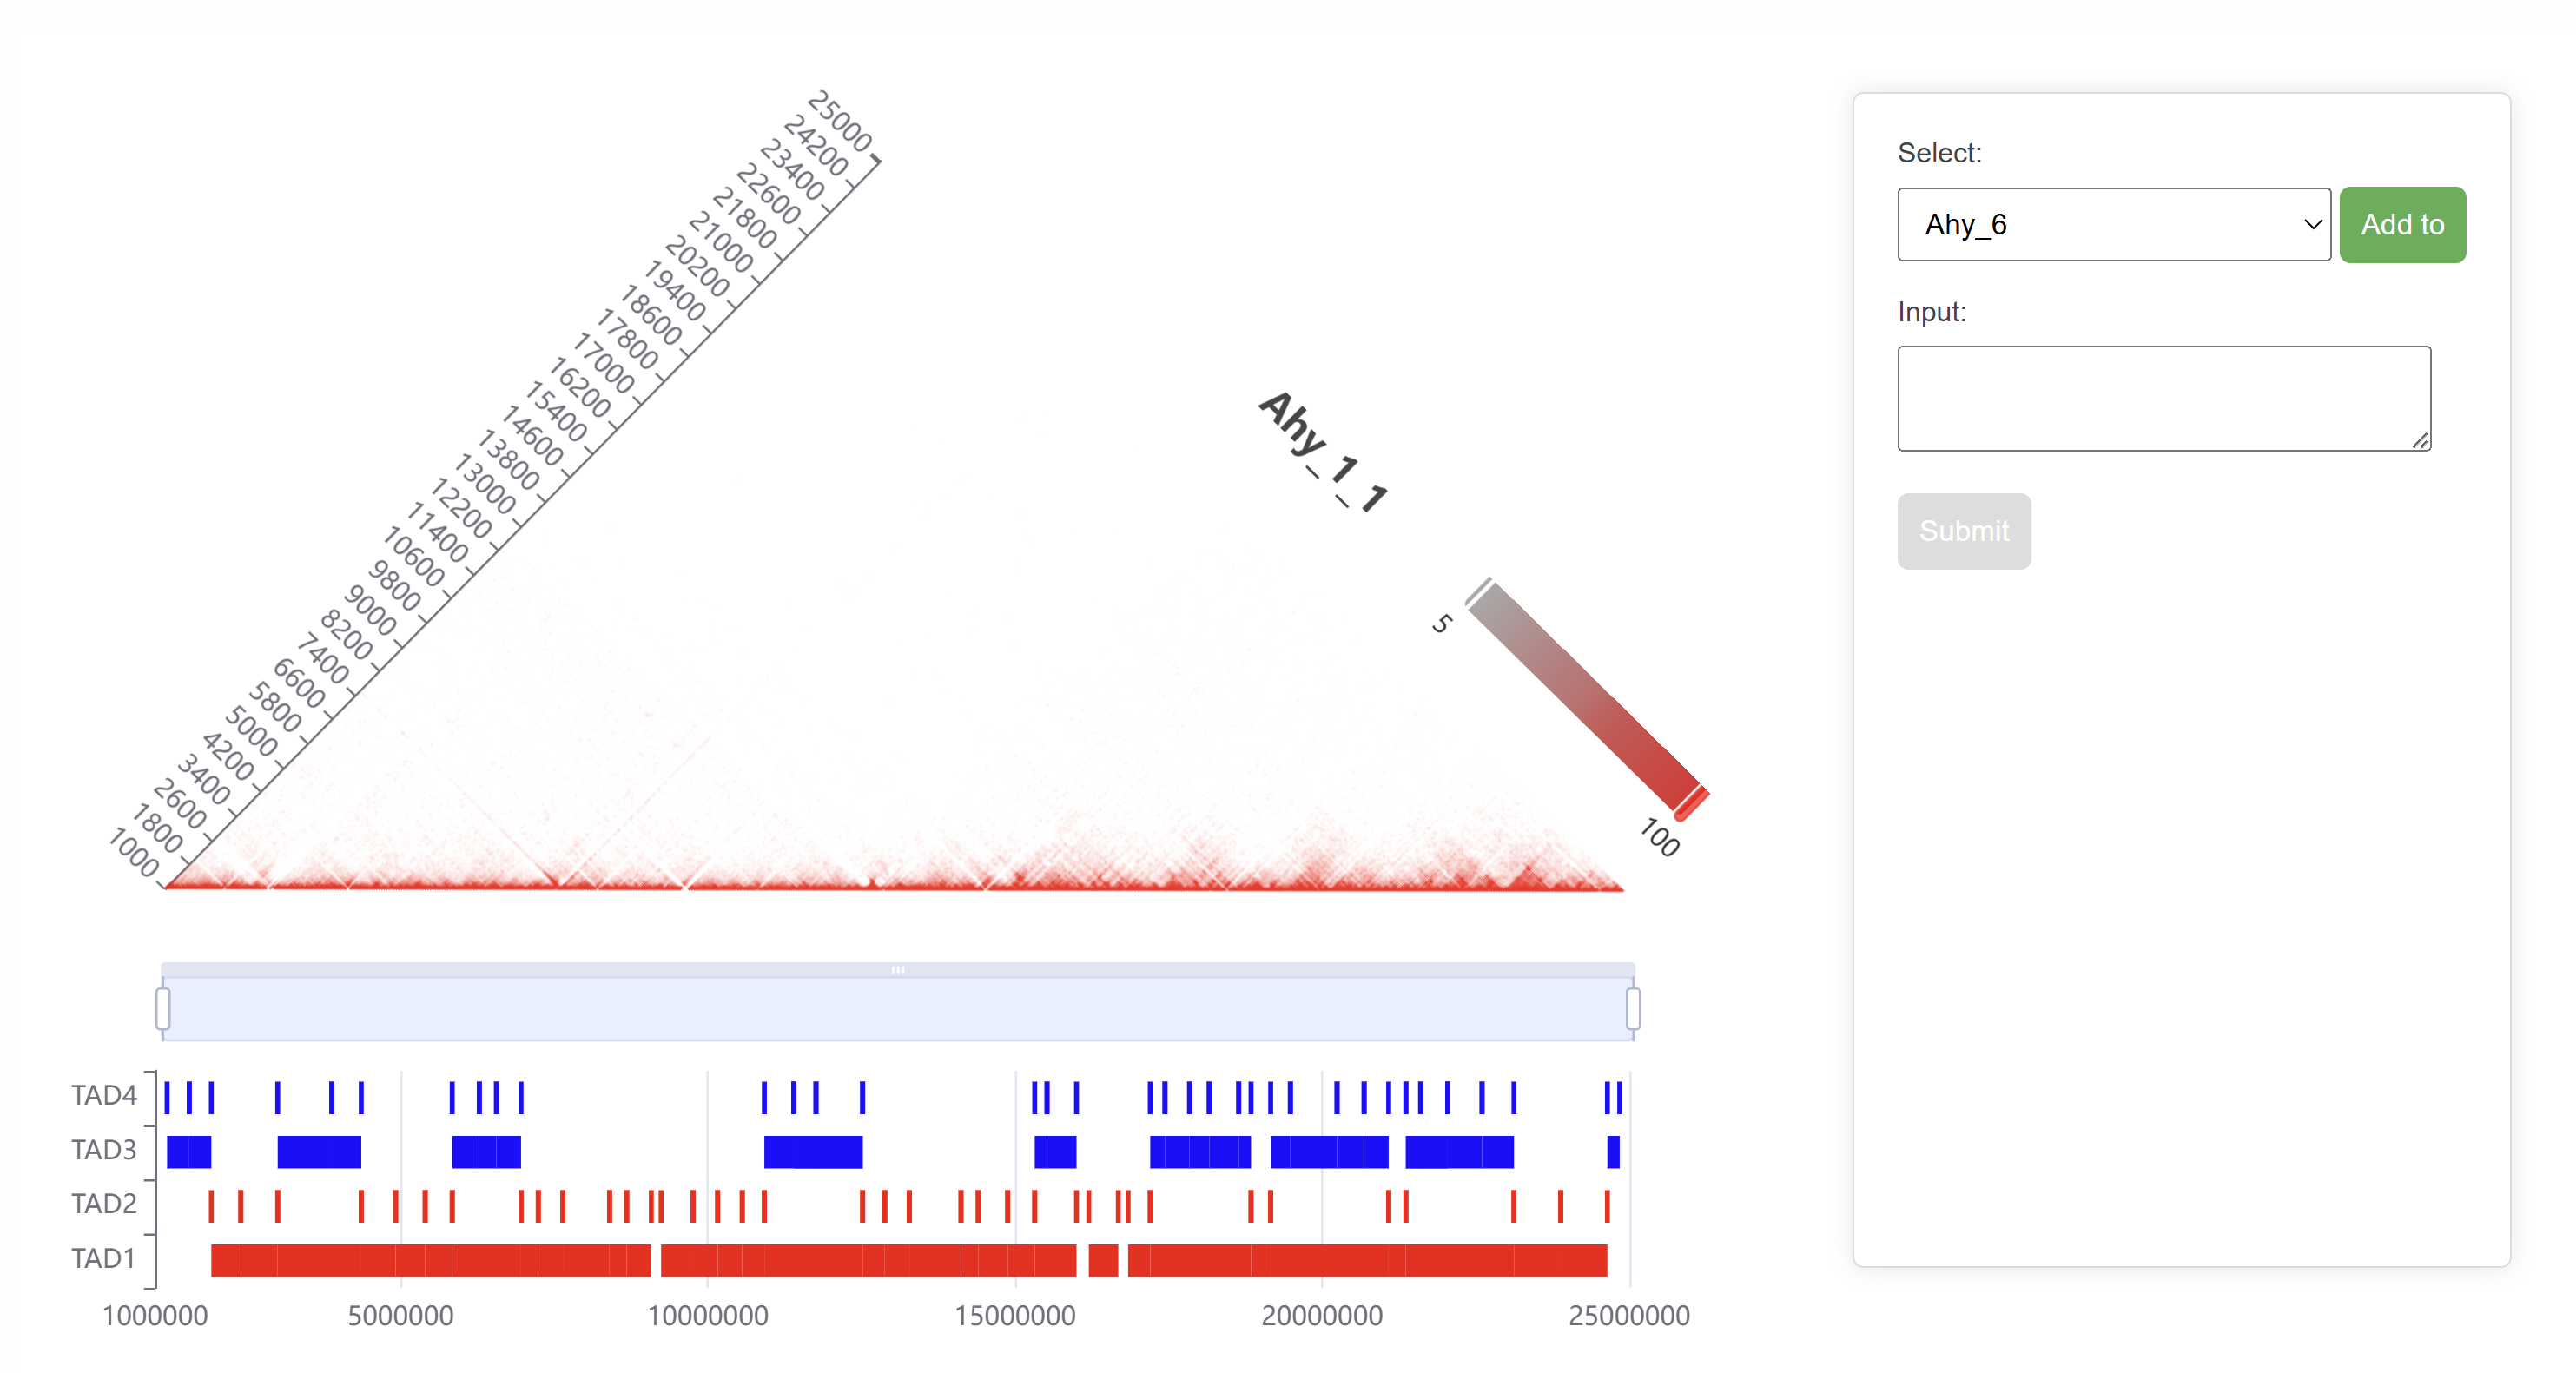
The selected region's Hi-C heatmap and TAD structure are displayed, providing a detailed view of topologically associating domains and their spatial organization. Users can select specific TADs and submit them to query the protein interaction networks within these TAD regions. This feature enables detailed exploration of protein interactions associated with selected TAD structures.
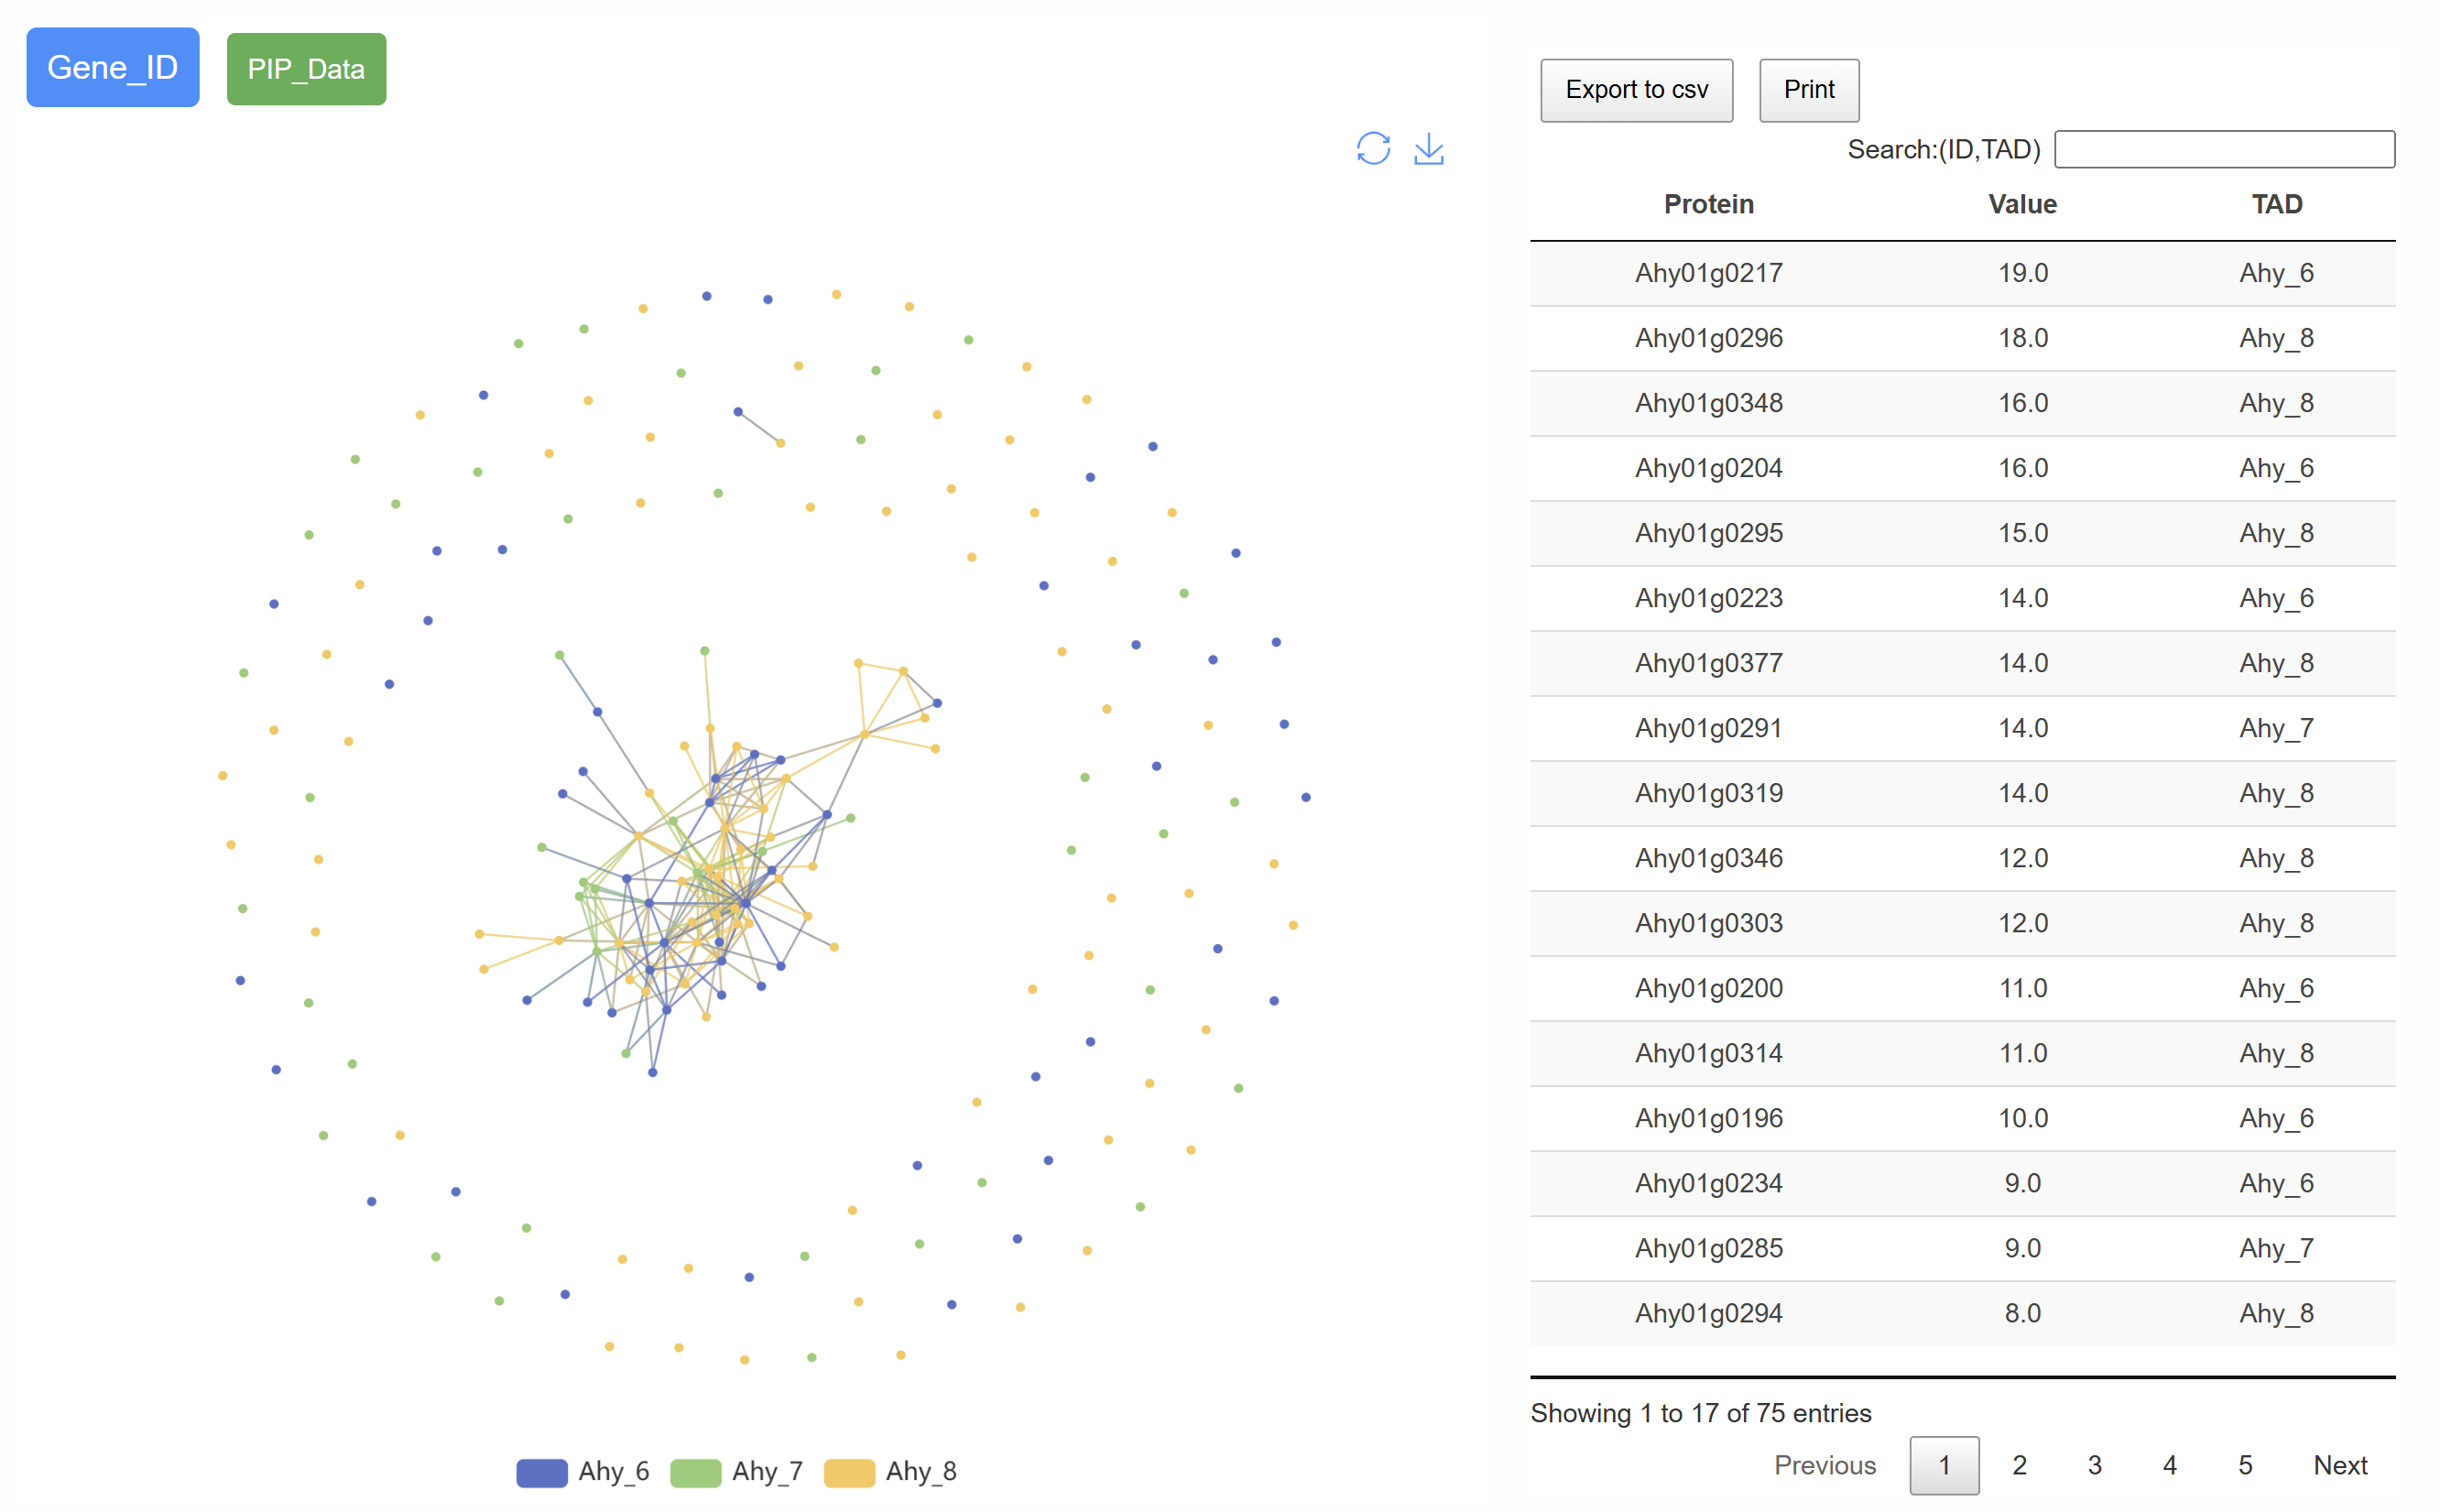
The page displays the gene interaction network within the selected TAD, highlighting core genes and their predicted functions within the regulatory network. This visualization provides insights into key genes and their potential roles in maintaining TAD structure and function.
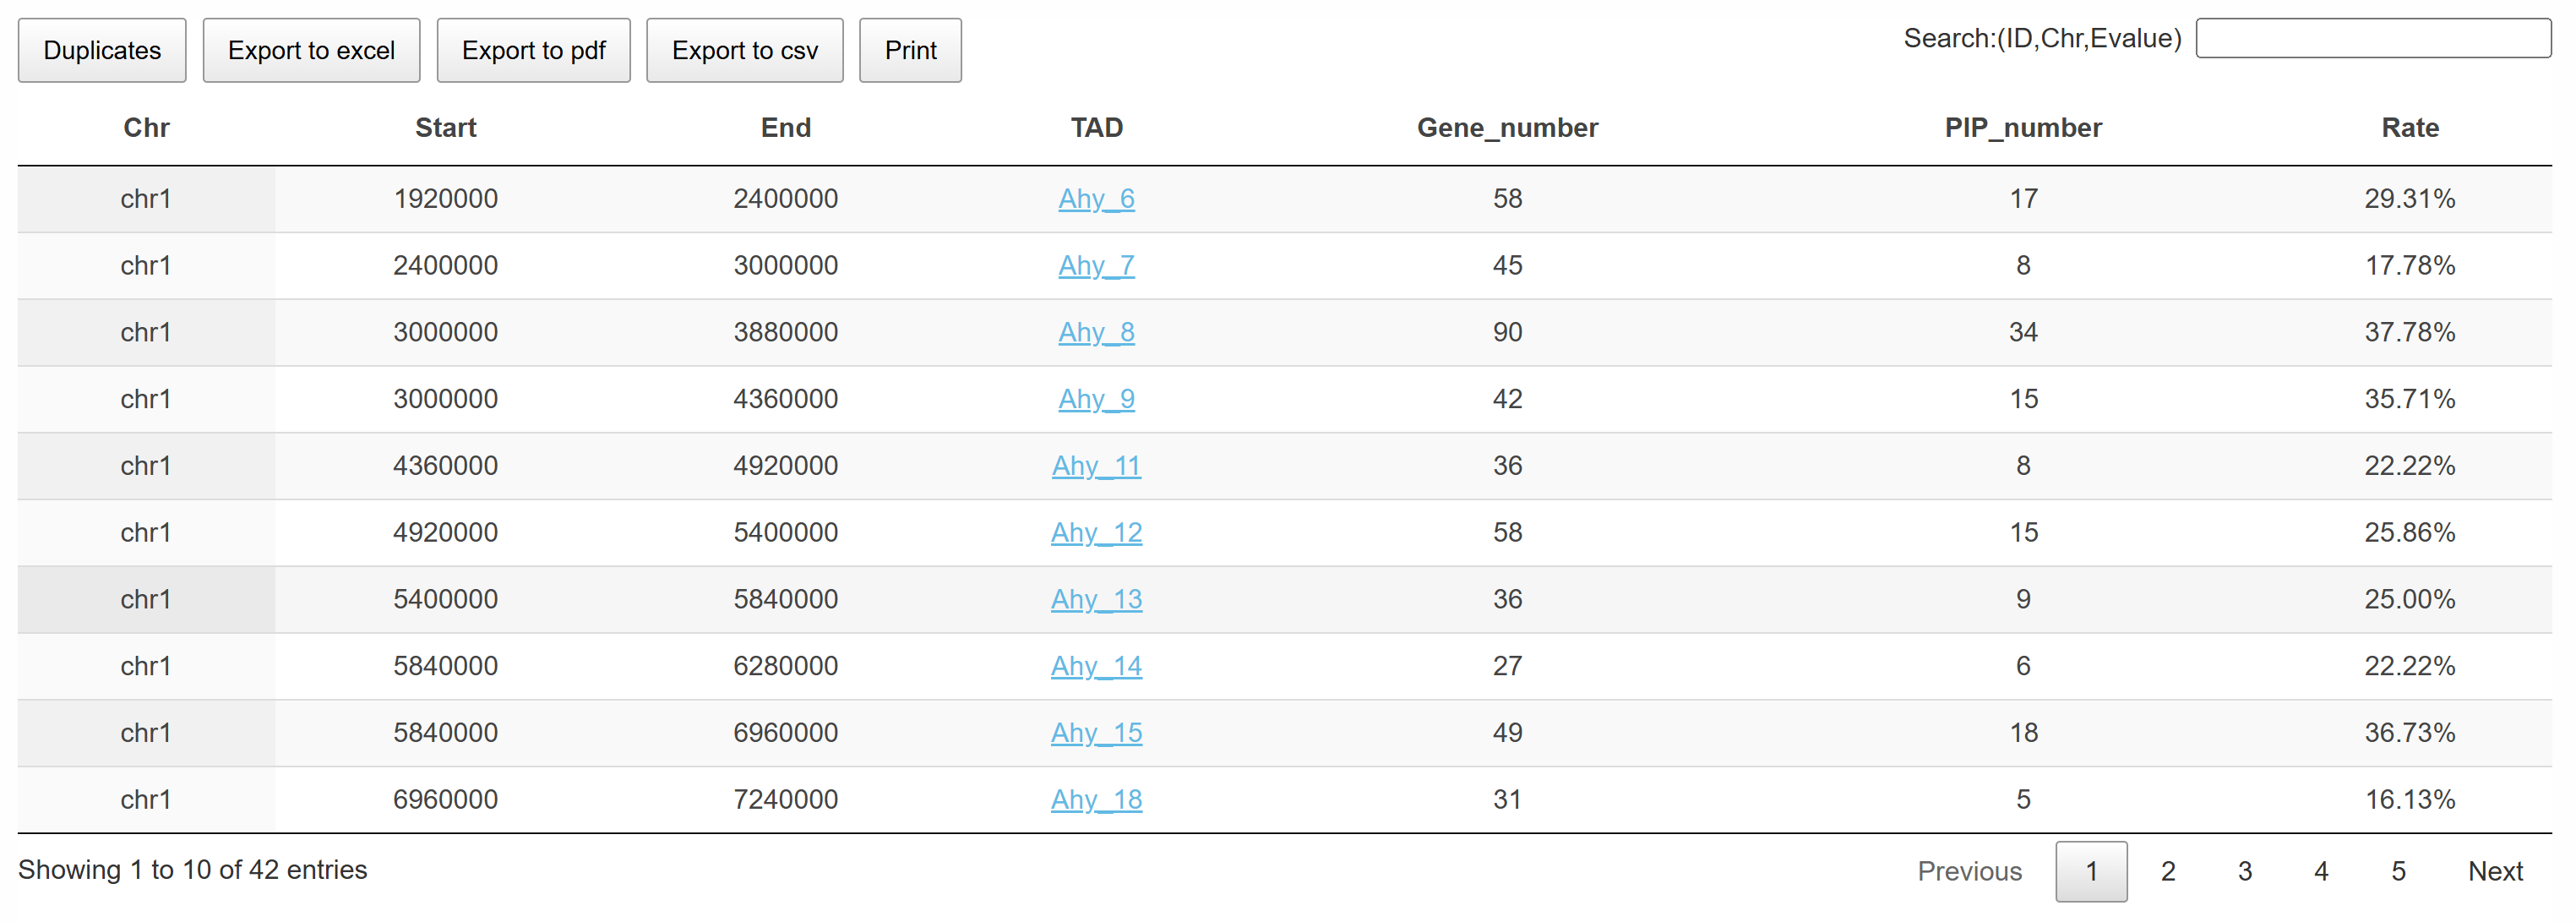
The page displays TAD information for the selected chromosome region. Users can click on the TAD name to directly navigate to the corresponding JBrowse interface, enabling detailed visualization and analysis of the TAD structure.
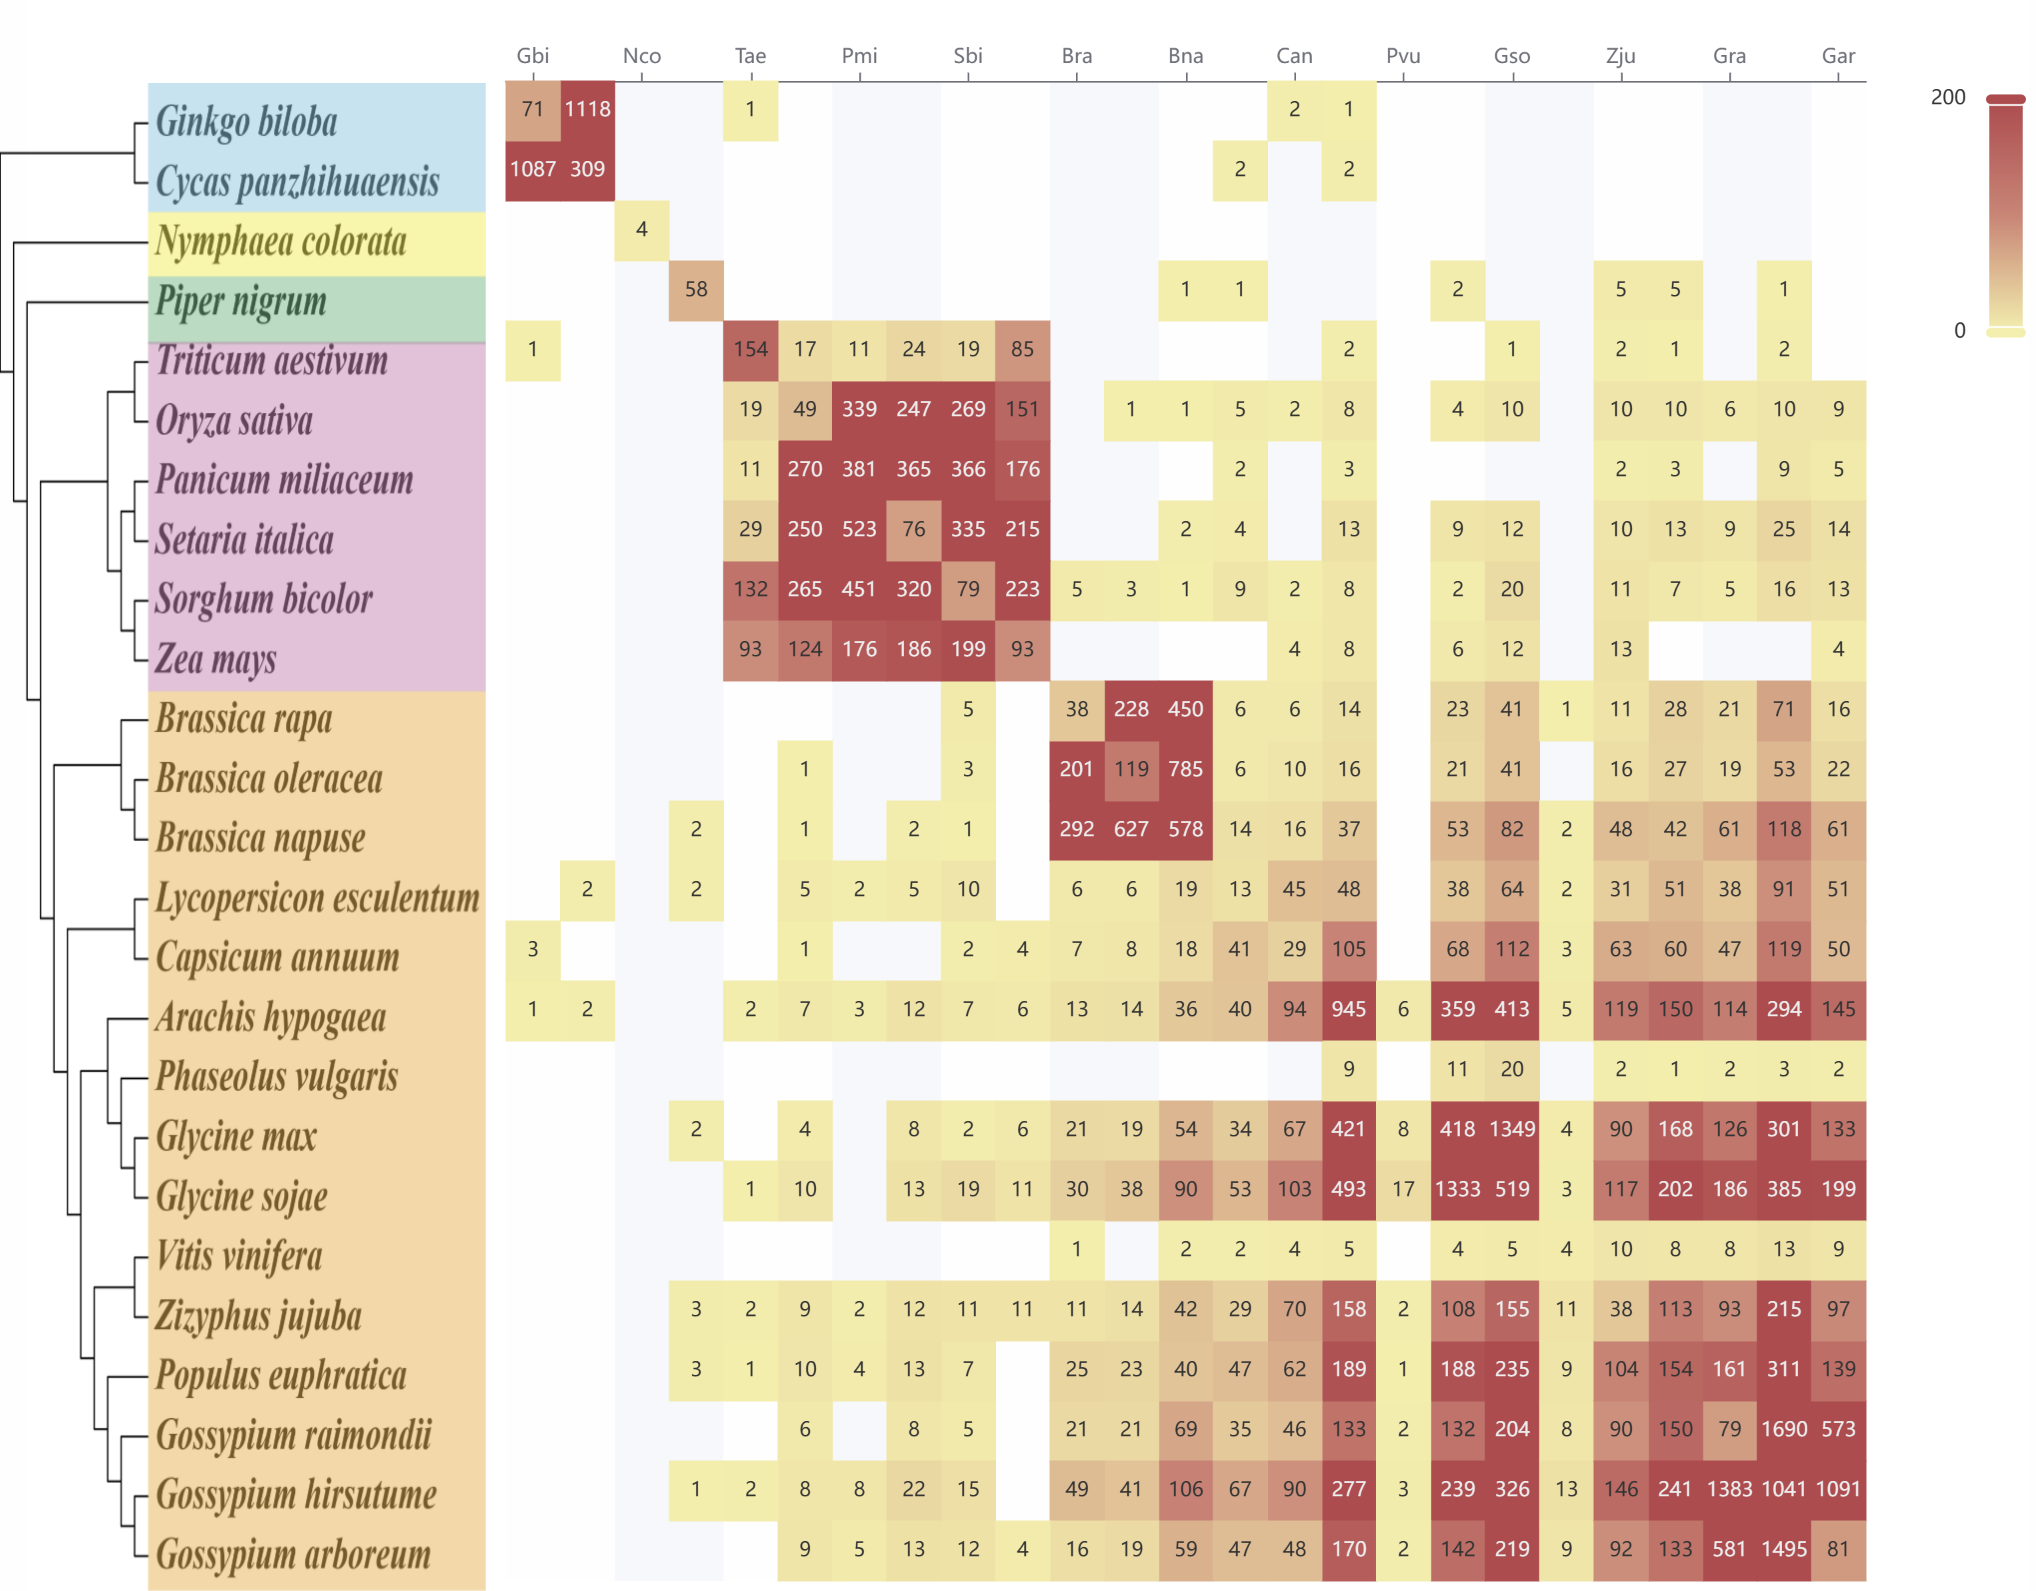
This page provides a comparative view of TAD structures between different species. Users can click on the numeric labels within the heatmap (representing the number of conserved TADs between two species) to access a detailed TAD comparison page for the selected species pair.
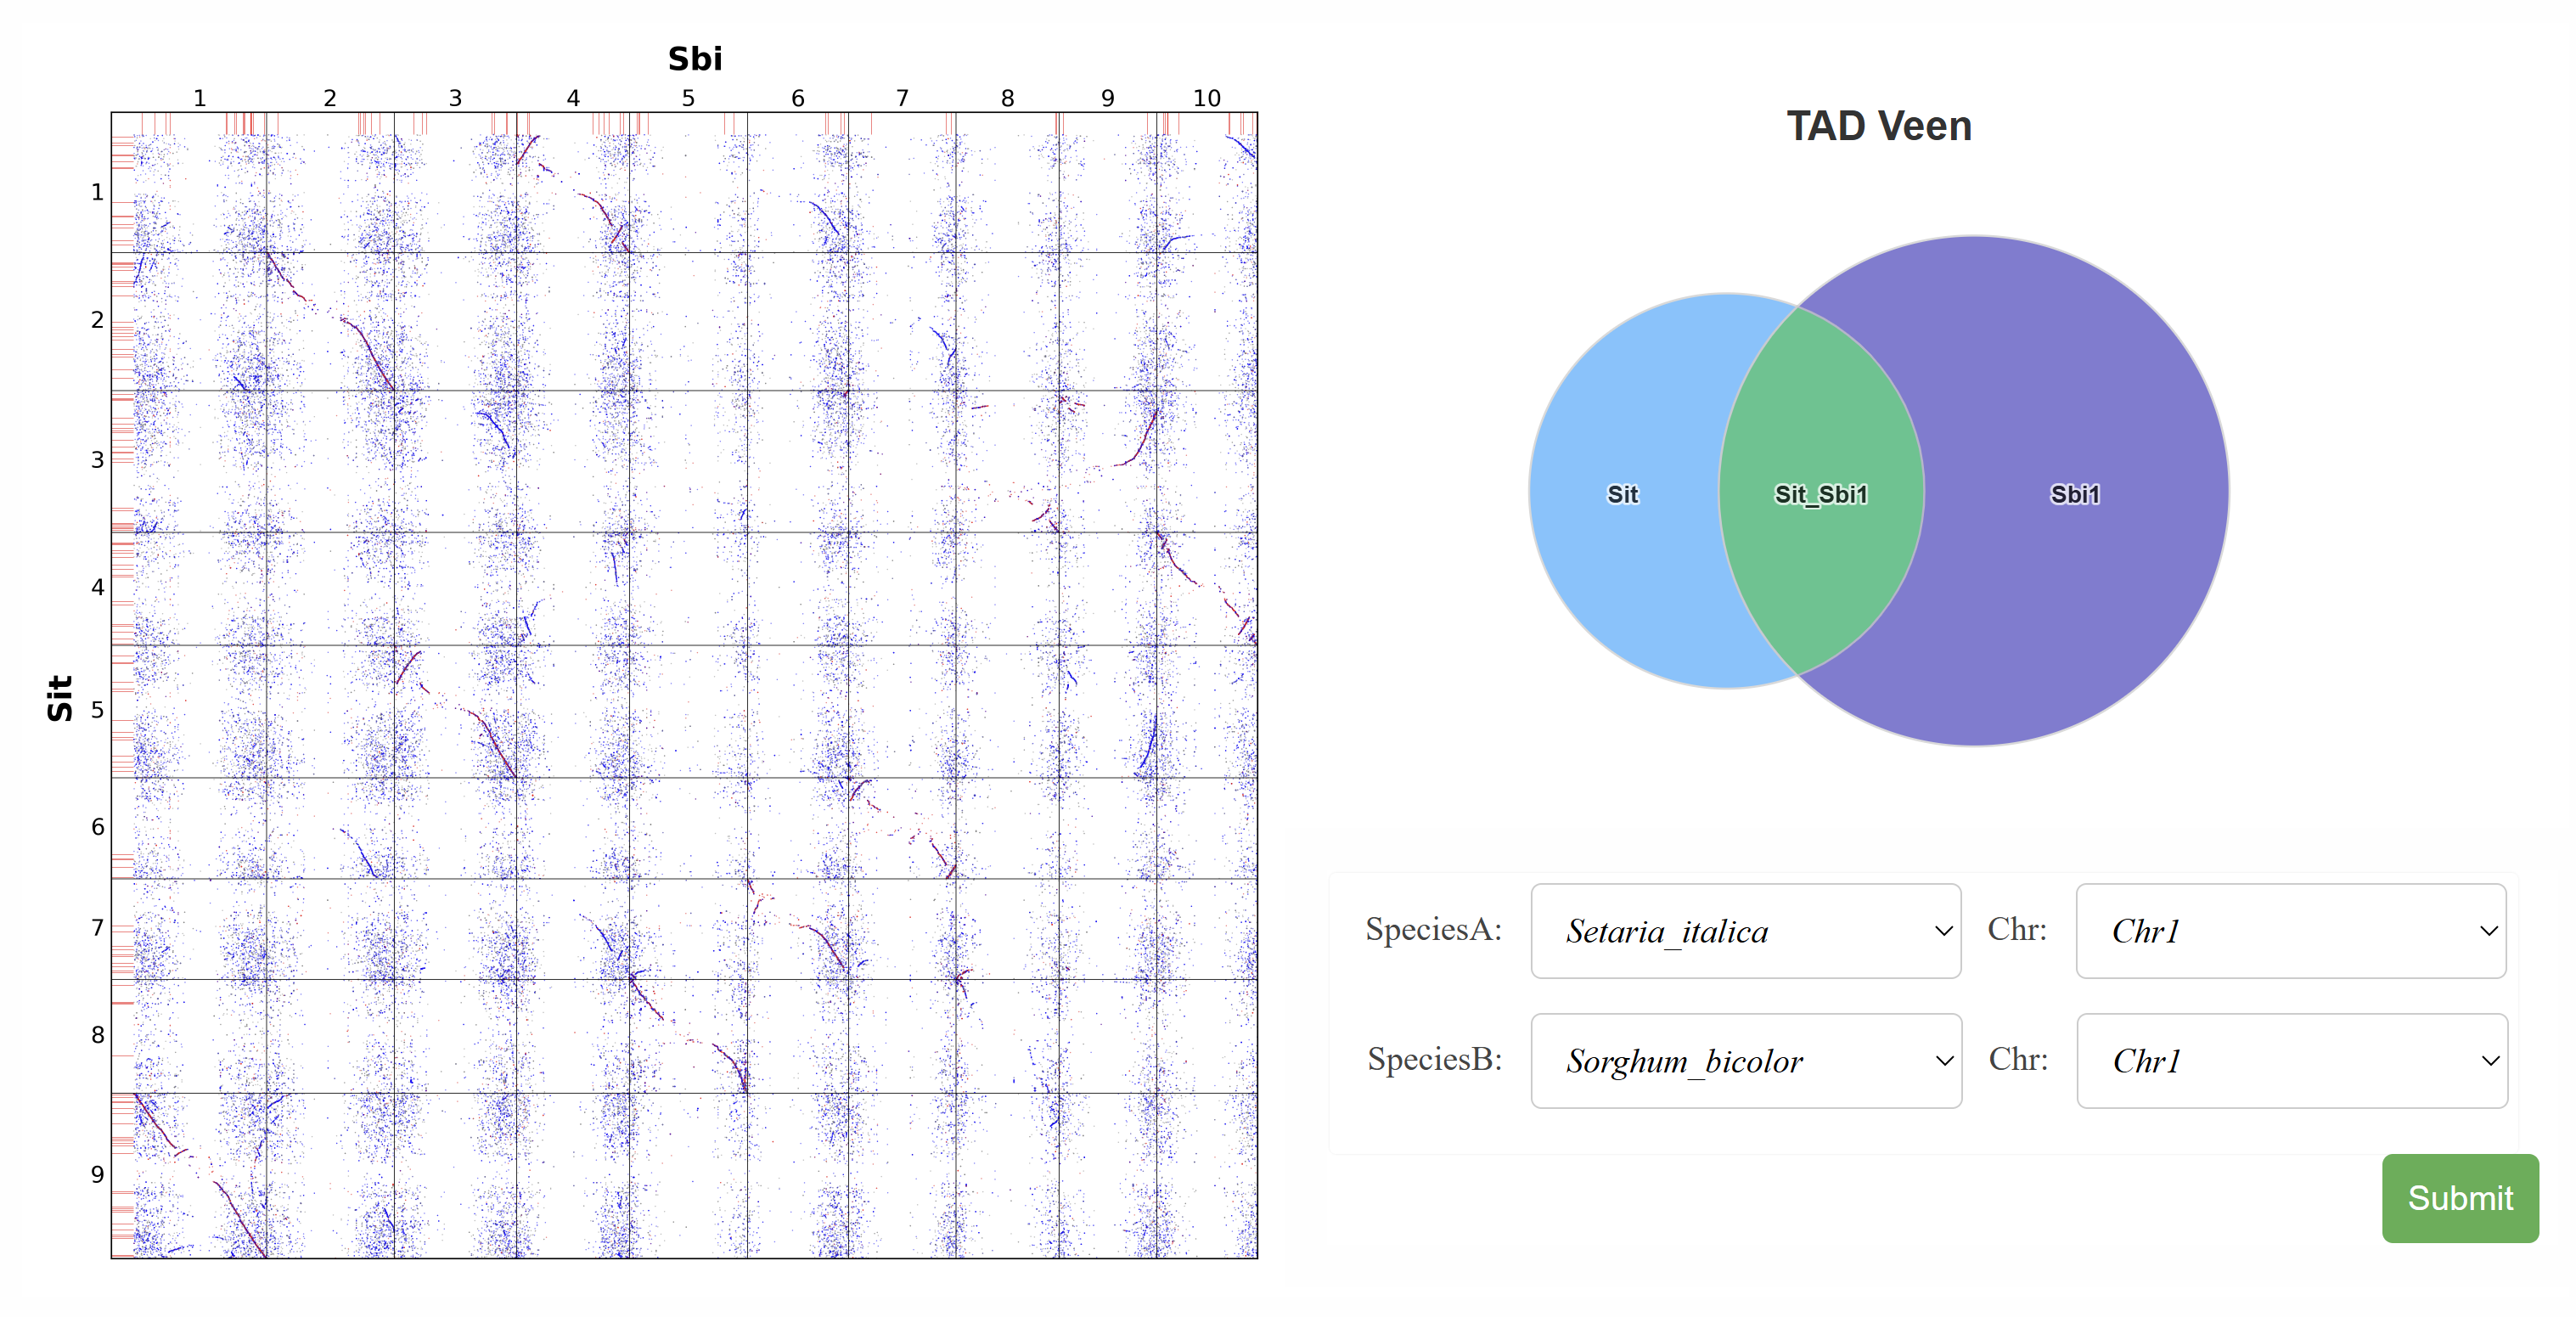
This page visualizes gene collinearity integrated with conserved TAD structures between species. A Venn diagram shows the number of species-specific and conserved TADs. Users can select specific chromosome pairs to display a detailed analysis of inter-chromosomal TAD structures, enabling comparative insights into chromosomal organization and conservation.
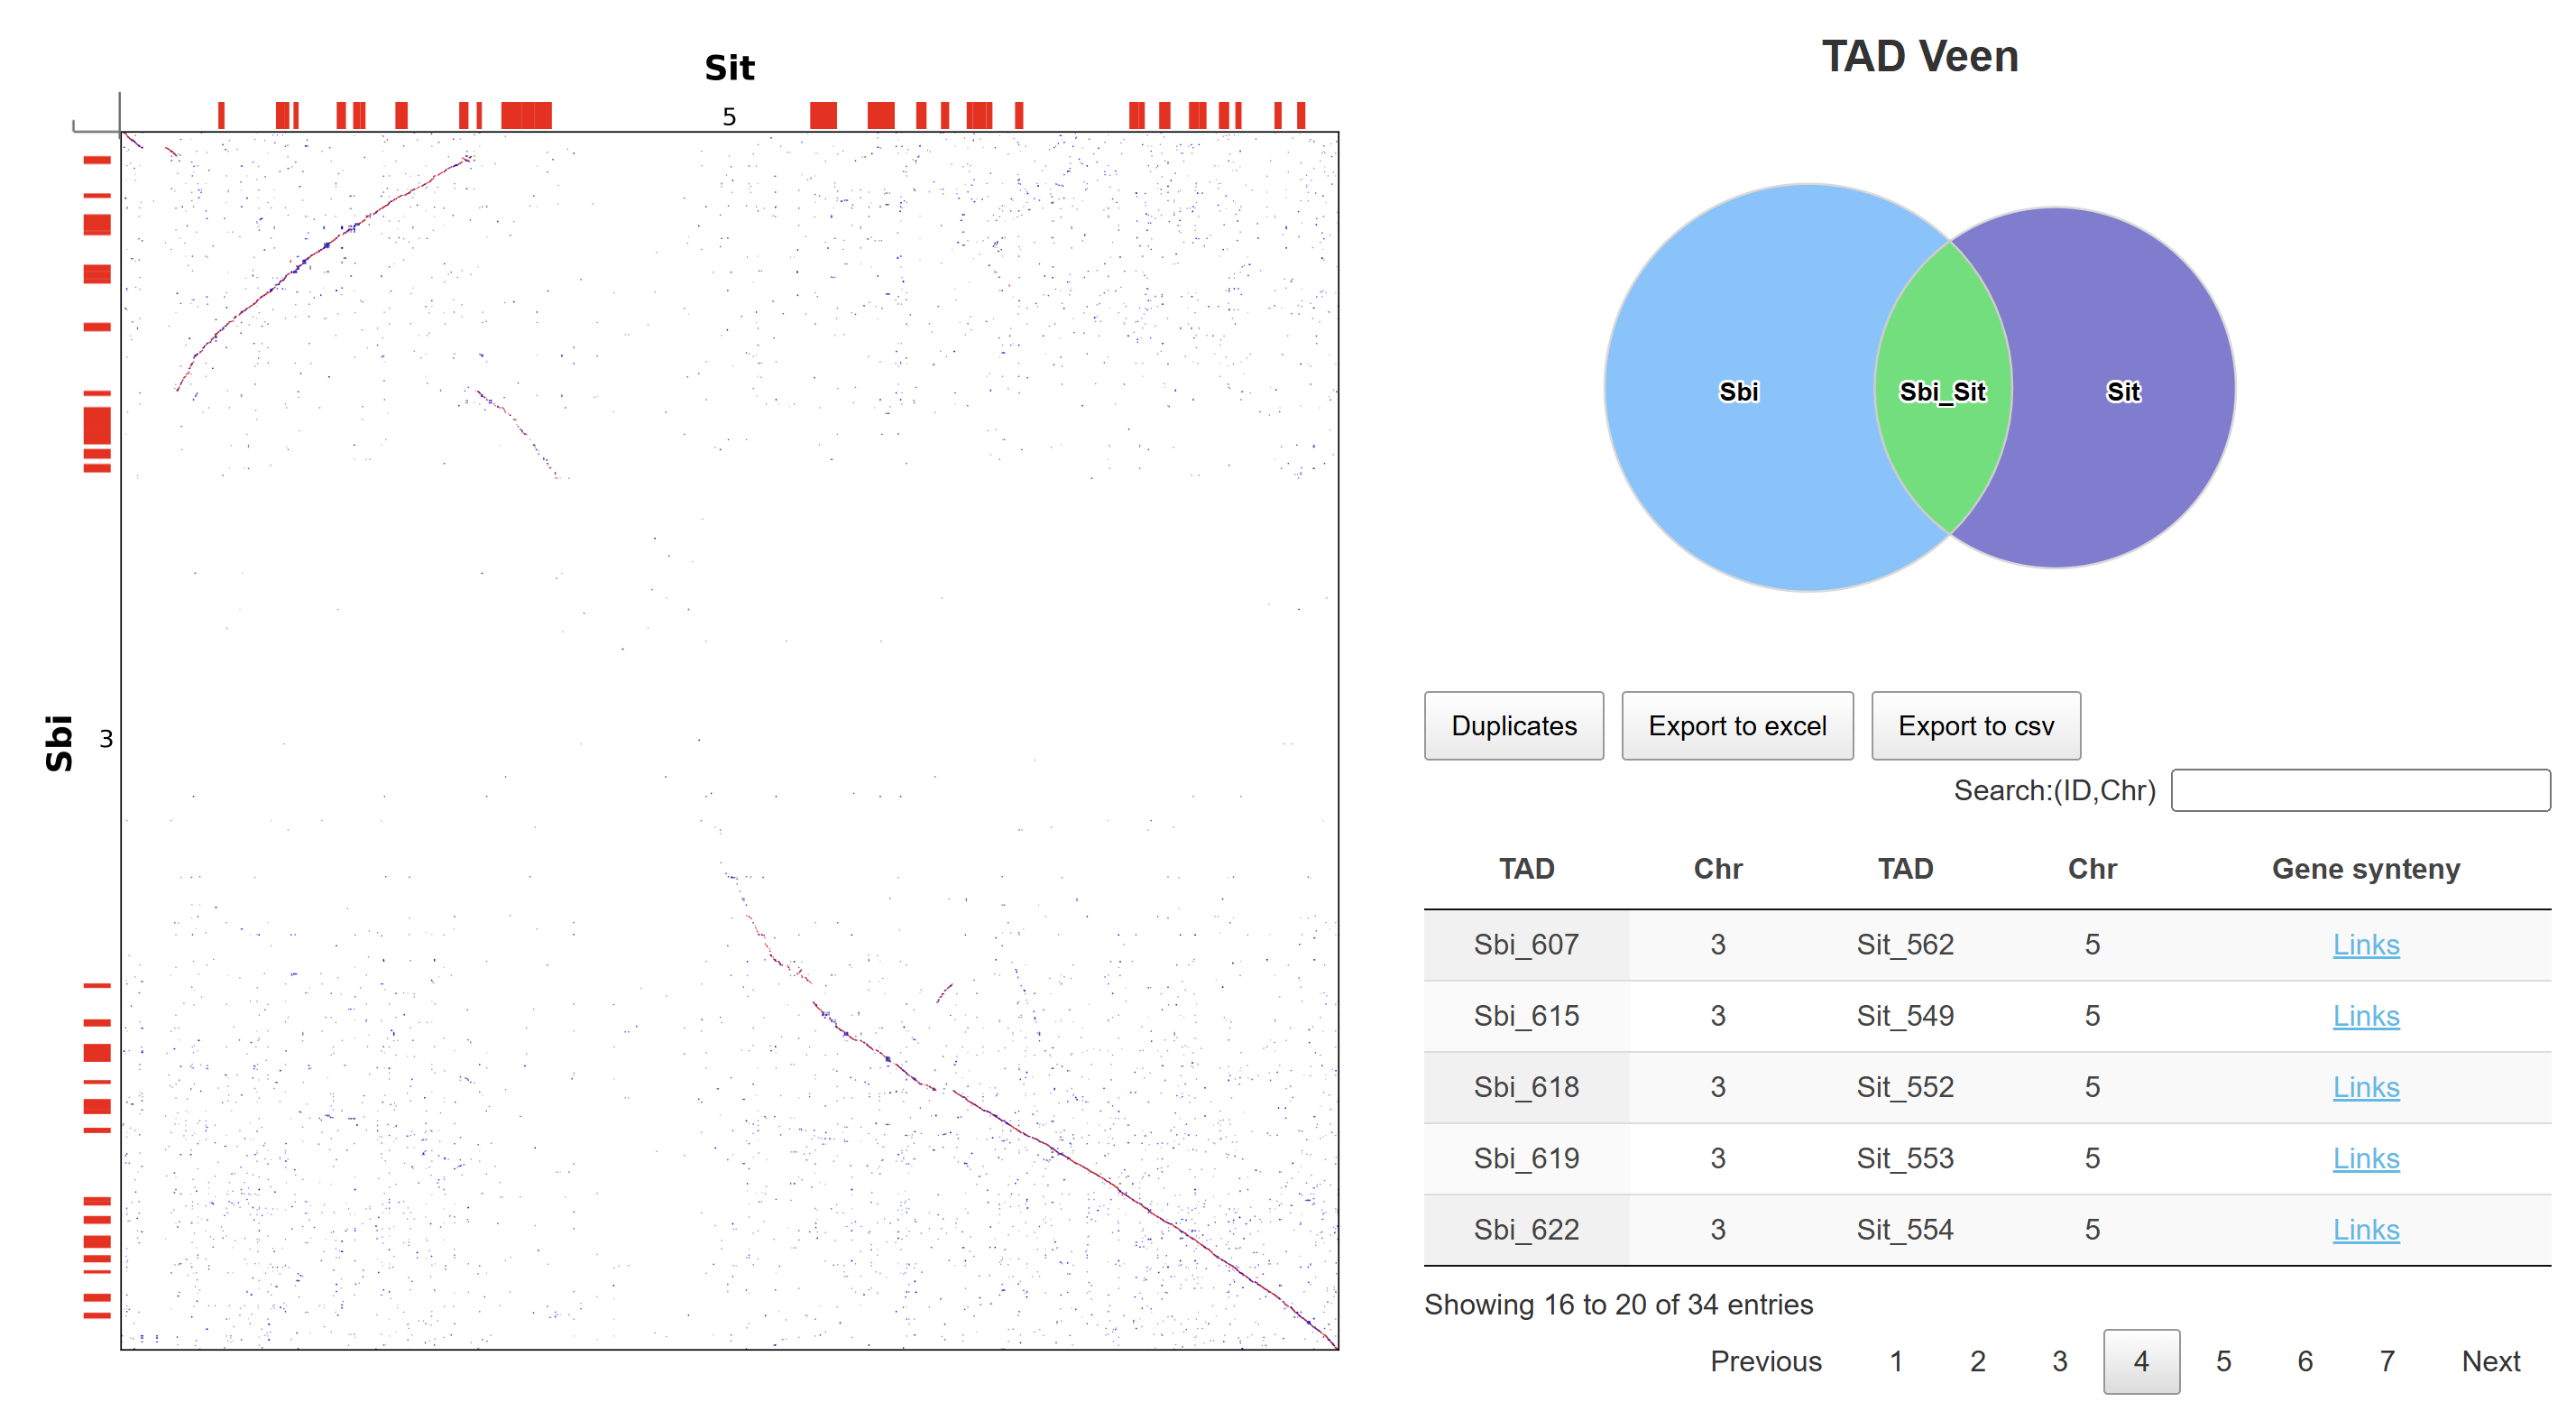
This page presents the collinearity results between two chromosomes, incorporating TAD structural information. A Venn diagram displays the number of chromosome-specific and conserved TADs. By clicking on the shared region in the Venn diagram, users are redirected to the inter-chromosomal TAD collinearity result page. In the result table, clicking the "Links" link navigates to the detailed comparison page between the corresponding TADs.
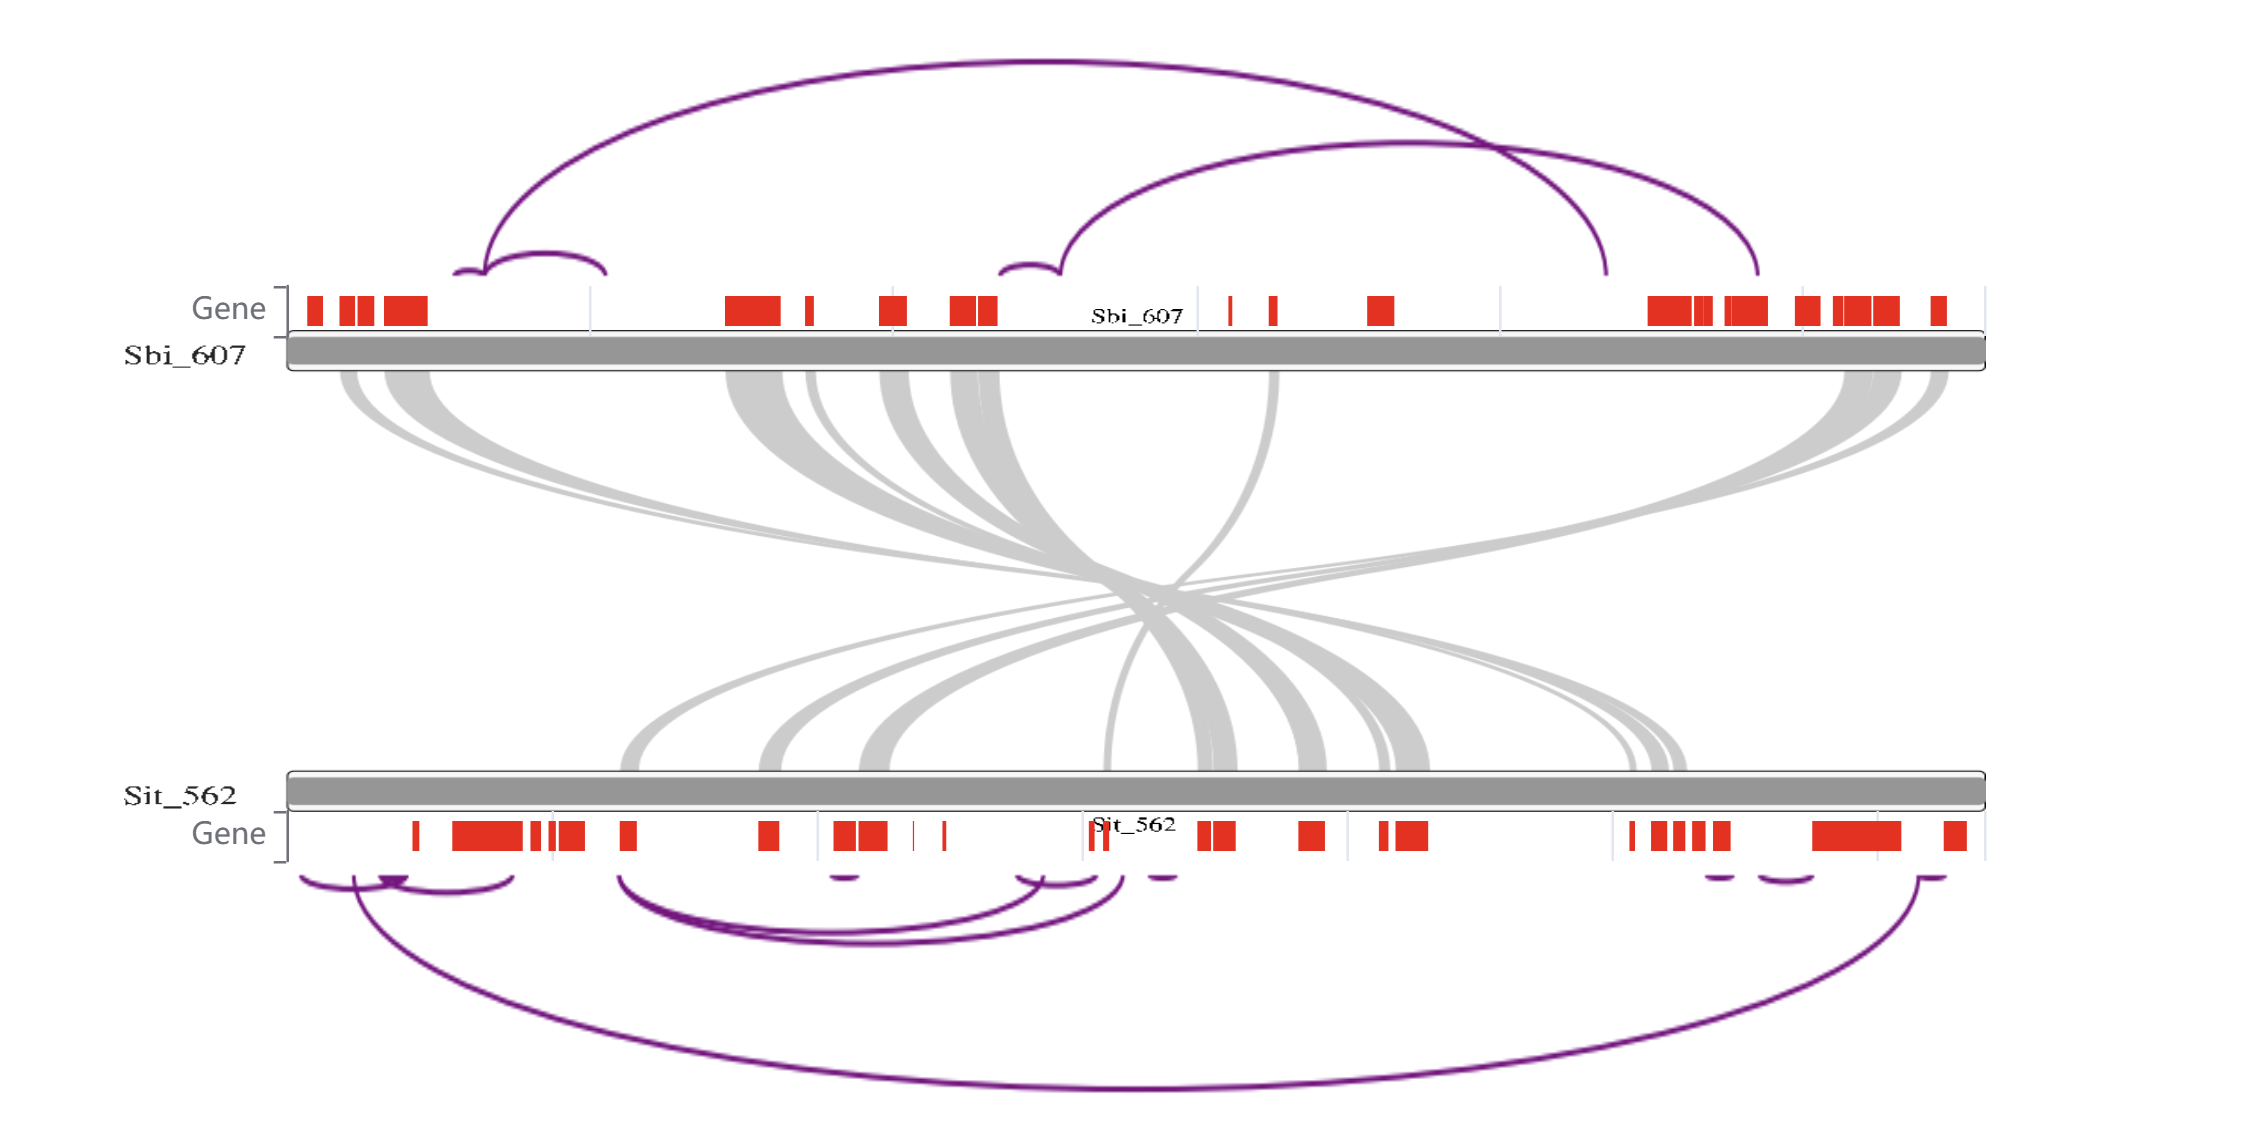
This page visualizes the gene collinearity and loop structures between two TADs. Hovering over a gene block displays the gene ID, allowing users to quickly identify and explore gene relationships within the TADs.
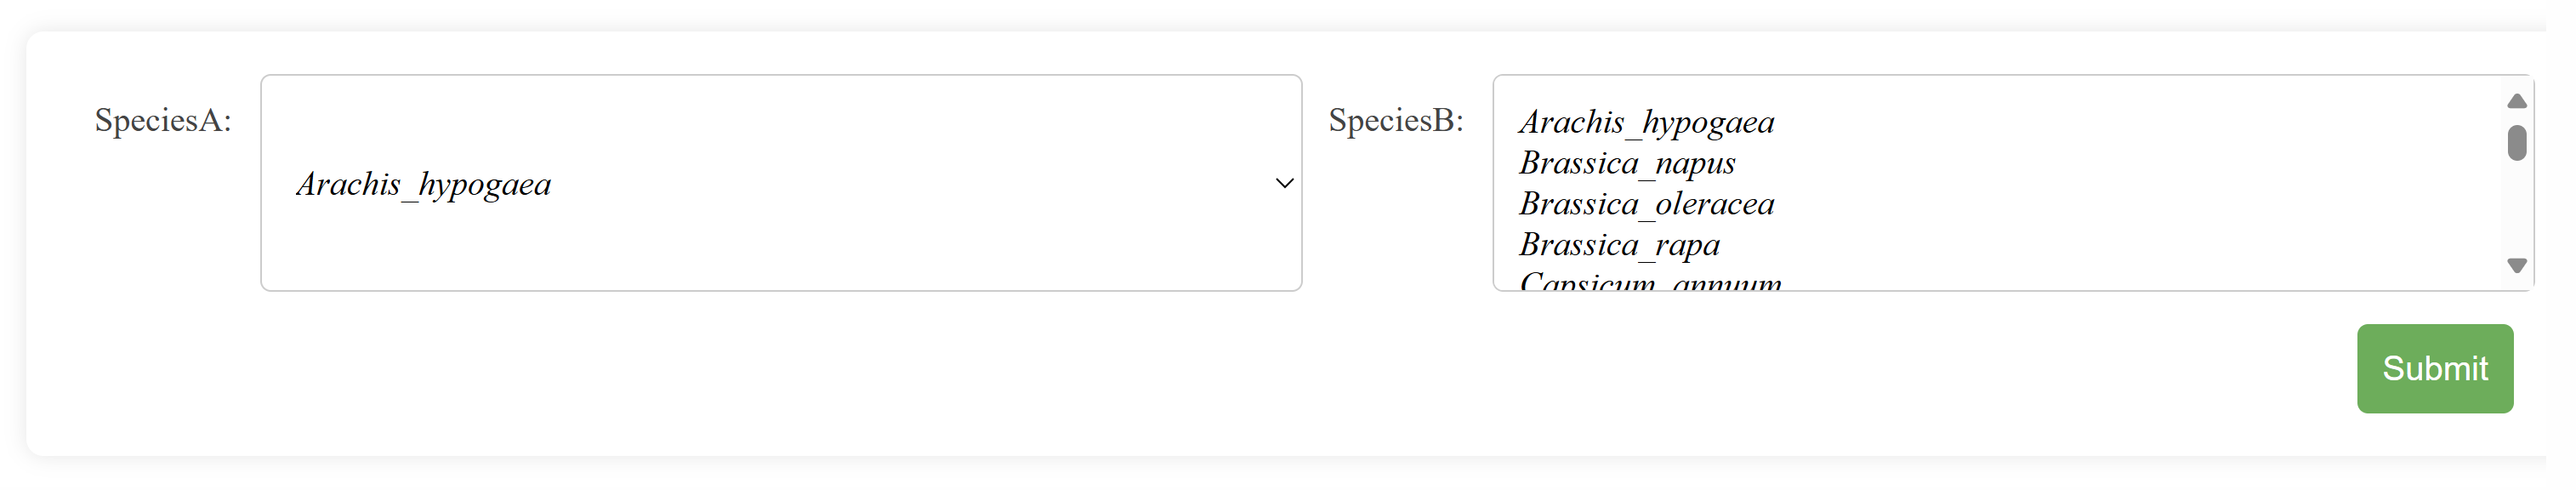
This page allows users to analyze conserved TAD structures across multiple species. Select a reference species and one or more comparison species, then click Submit to initiate the analysis. The results will display conserved and divergent TAD structures between the selected species, providing insights into evolutionary conservation and variation.
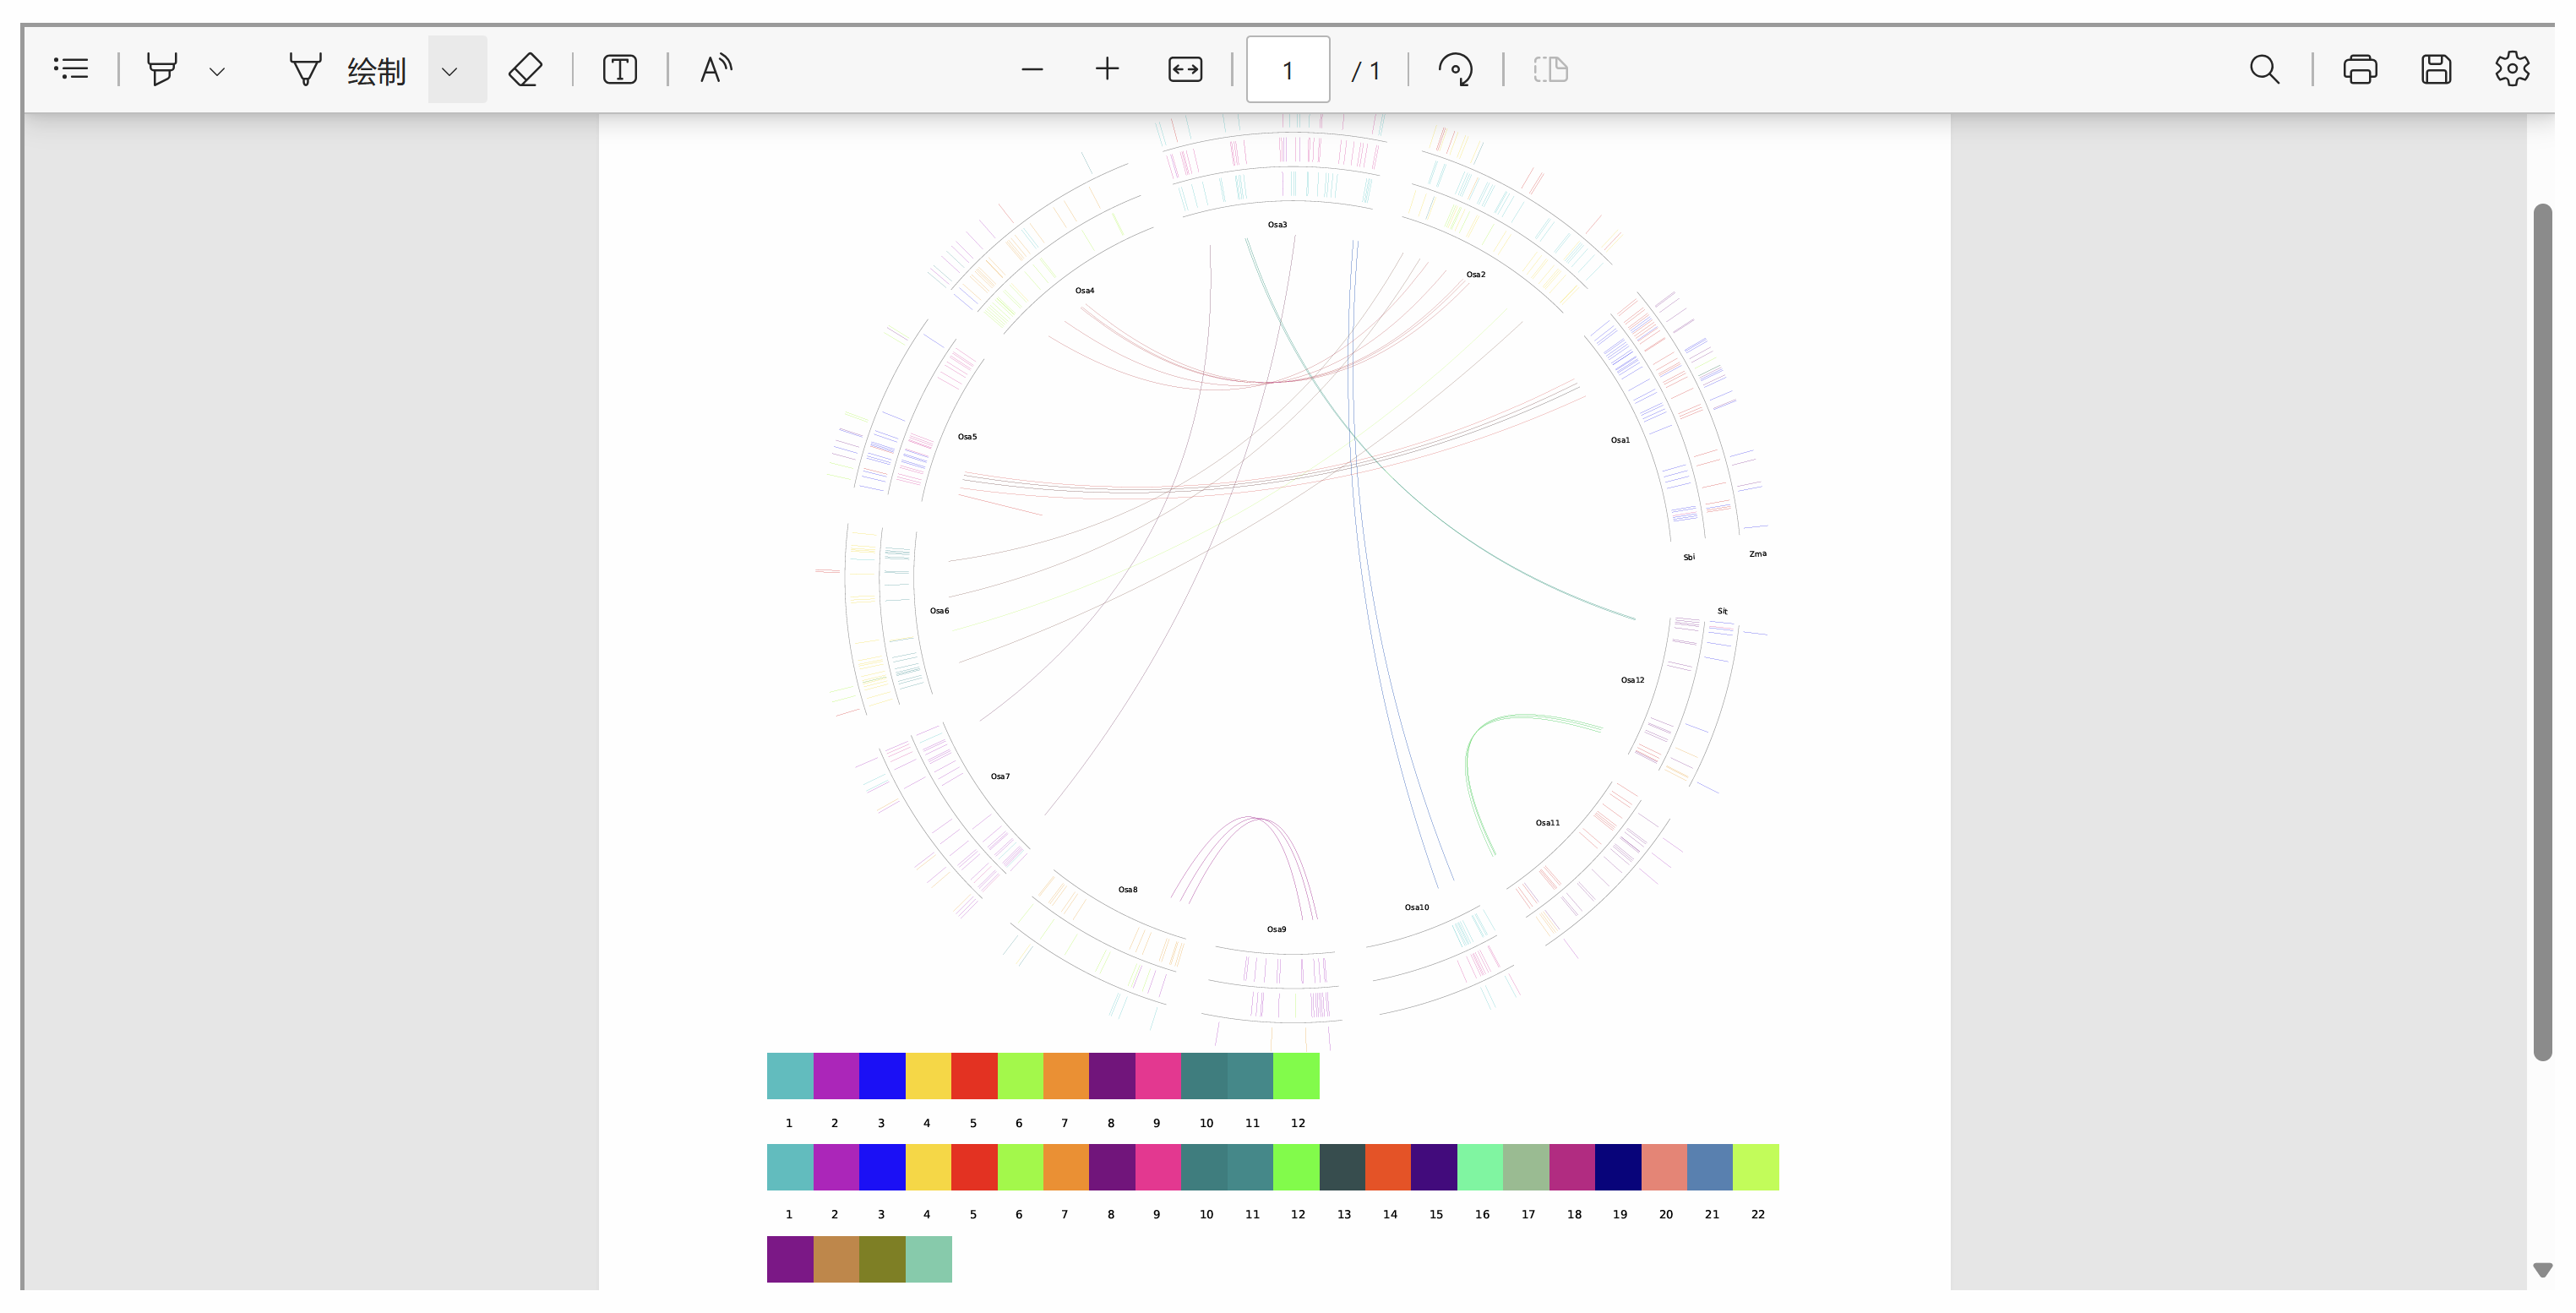
This page displays a circular plot illustrating conserved TAD structures across multiple species. Outer Circle Links: Represent conserved TAD structures between the selected species and the reference species. Inner Circle Links: Indicate conserved TAD structures within the reference species itself. Users can directly save the resulting plot as a PDF for further analysis and documentation.
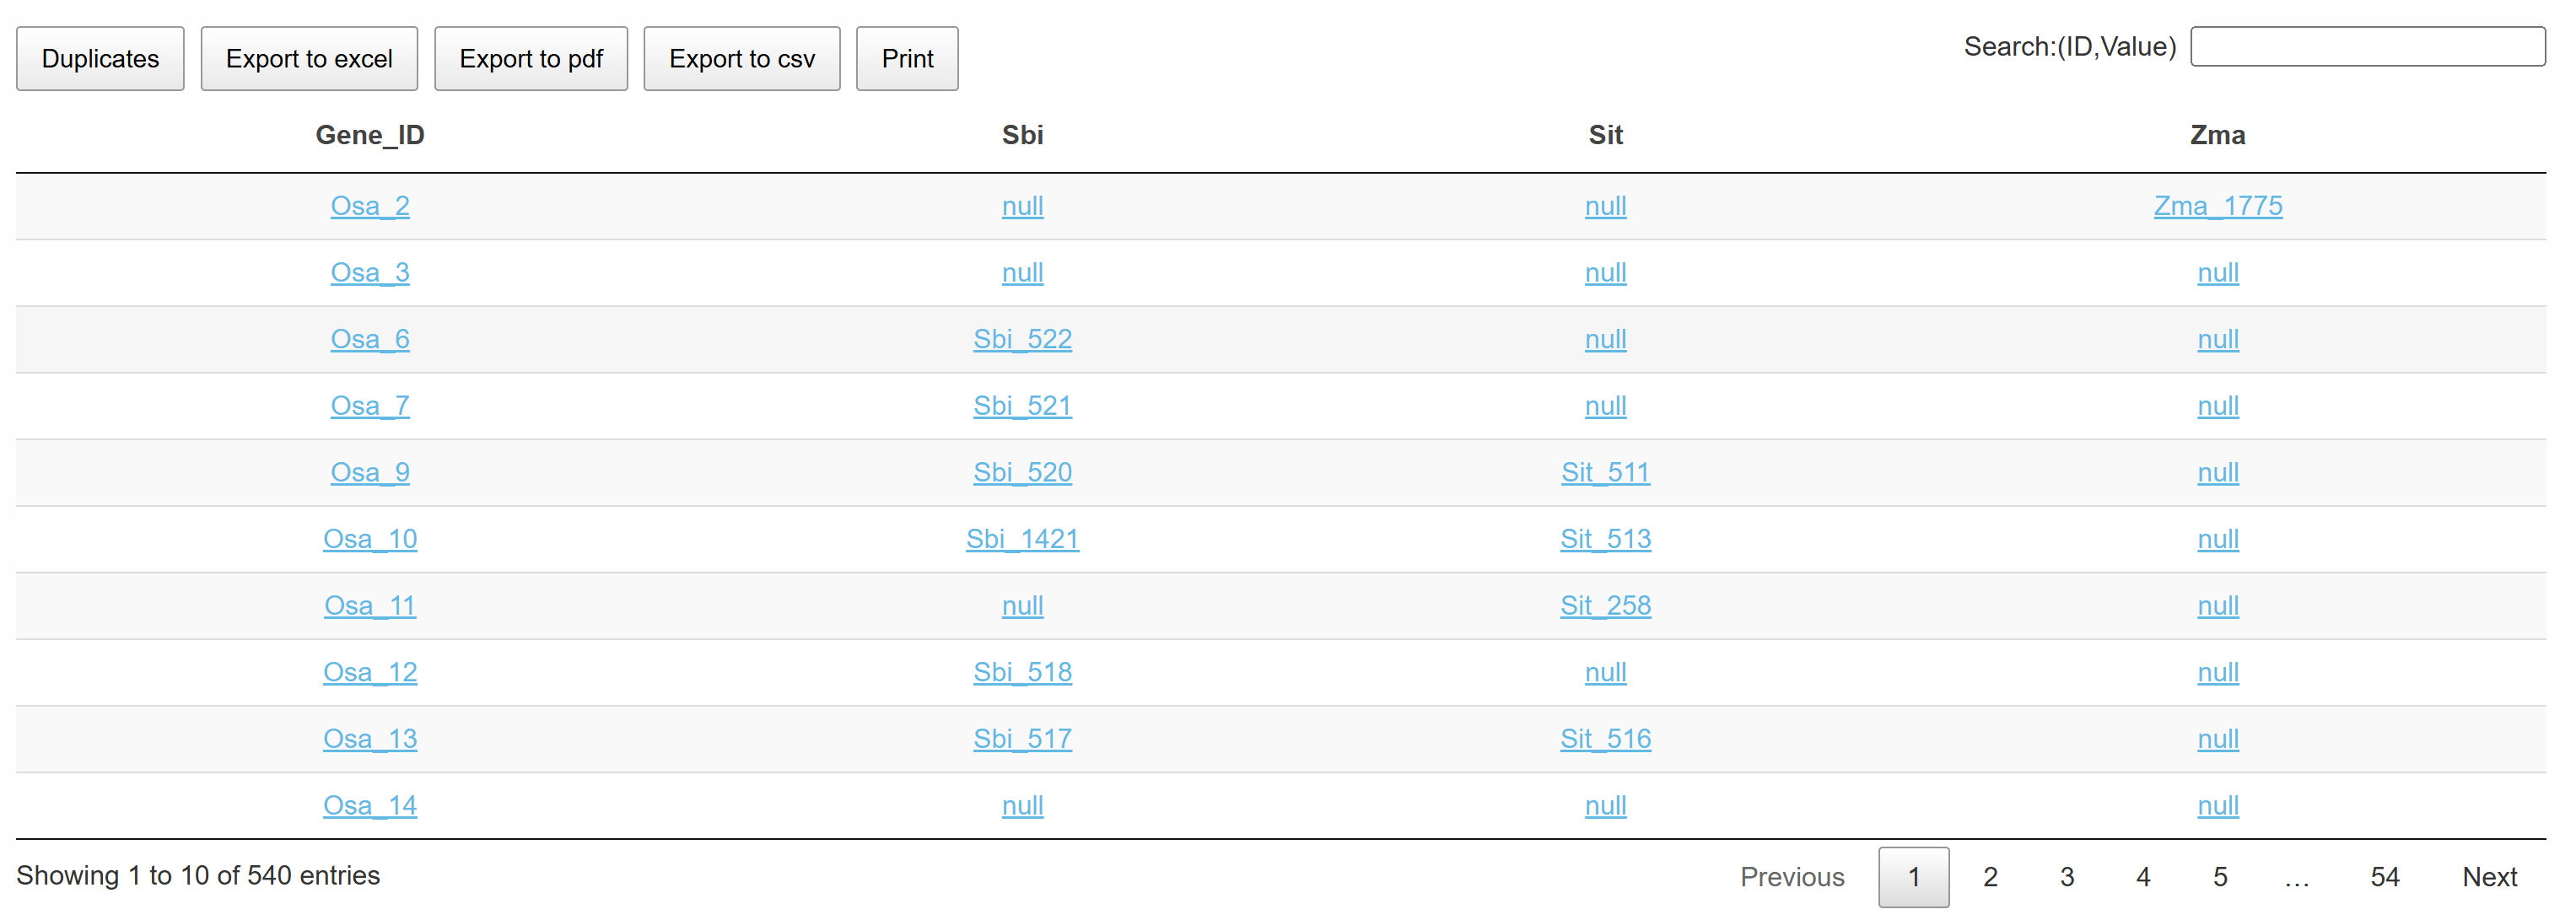
This page displays a comprehensive list of conserved TAD structures across multiple species. Clicking on the TAD name in the table redirects to a detailed page, which includes the gene regulatory network and gene annotation information within the TAD. This interactive list helps users explore conserved TAD structures efficiently and gain insights into gene regulation and functional conservation.
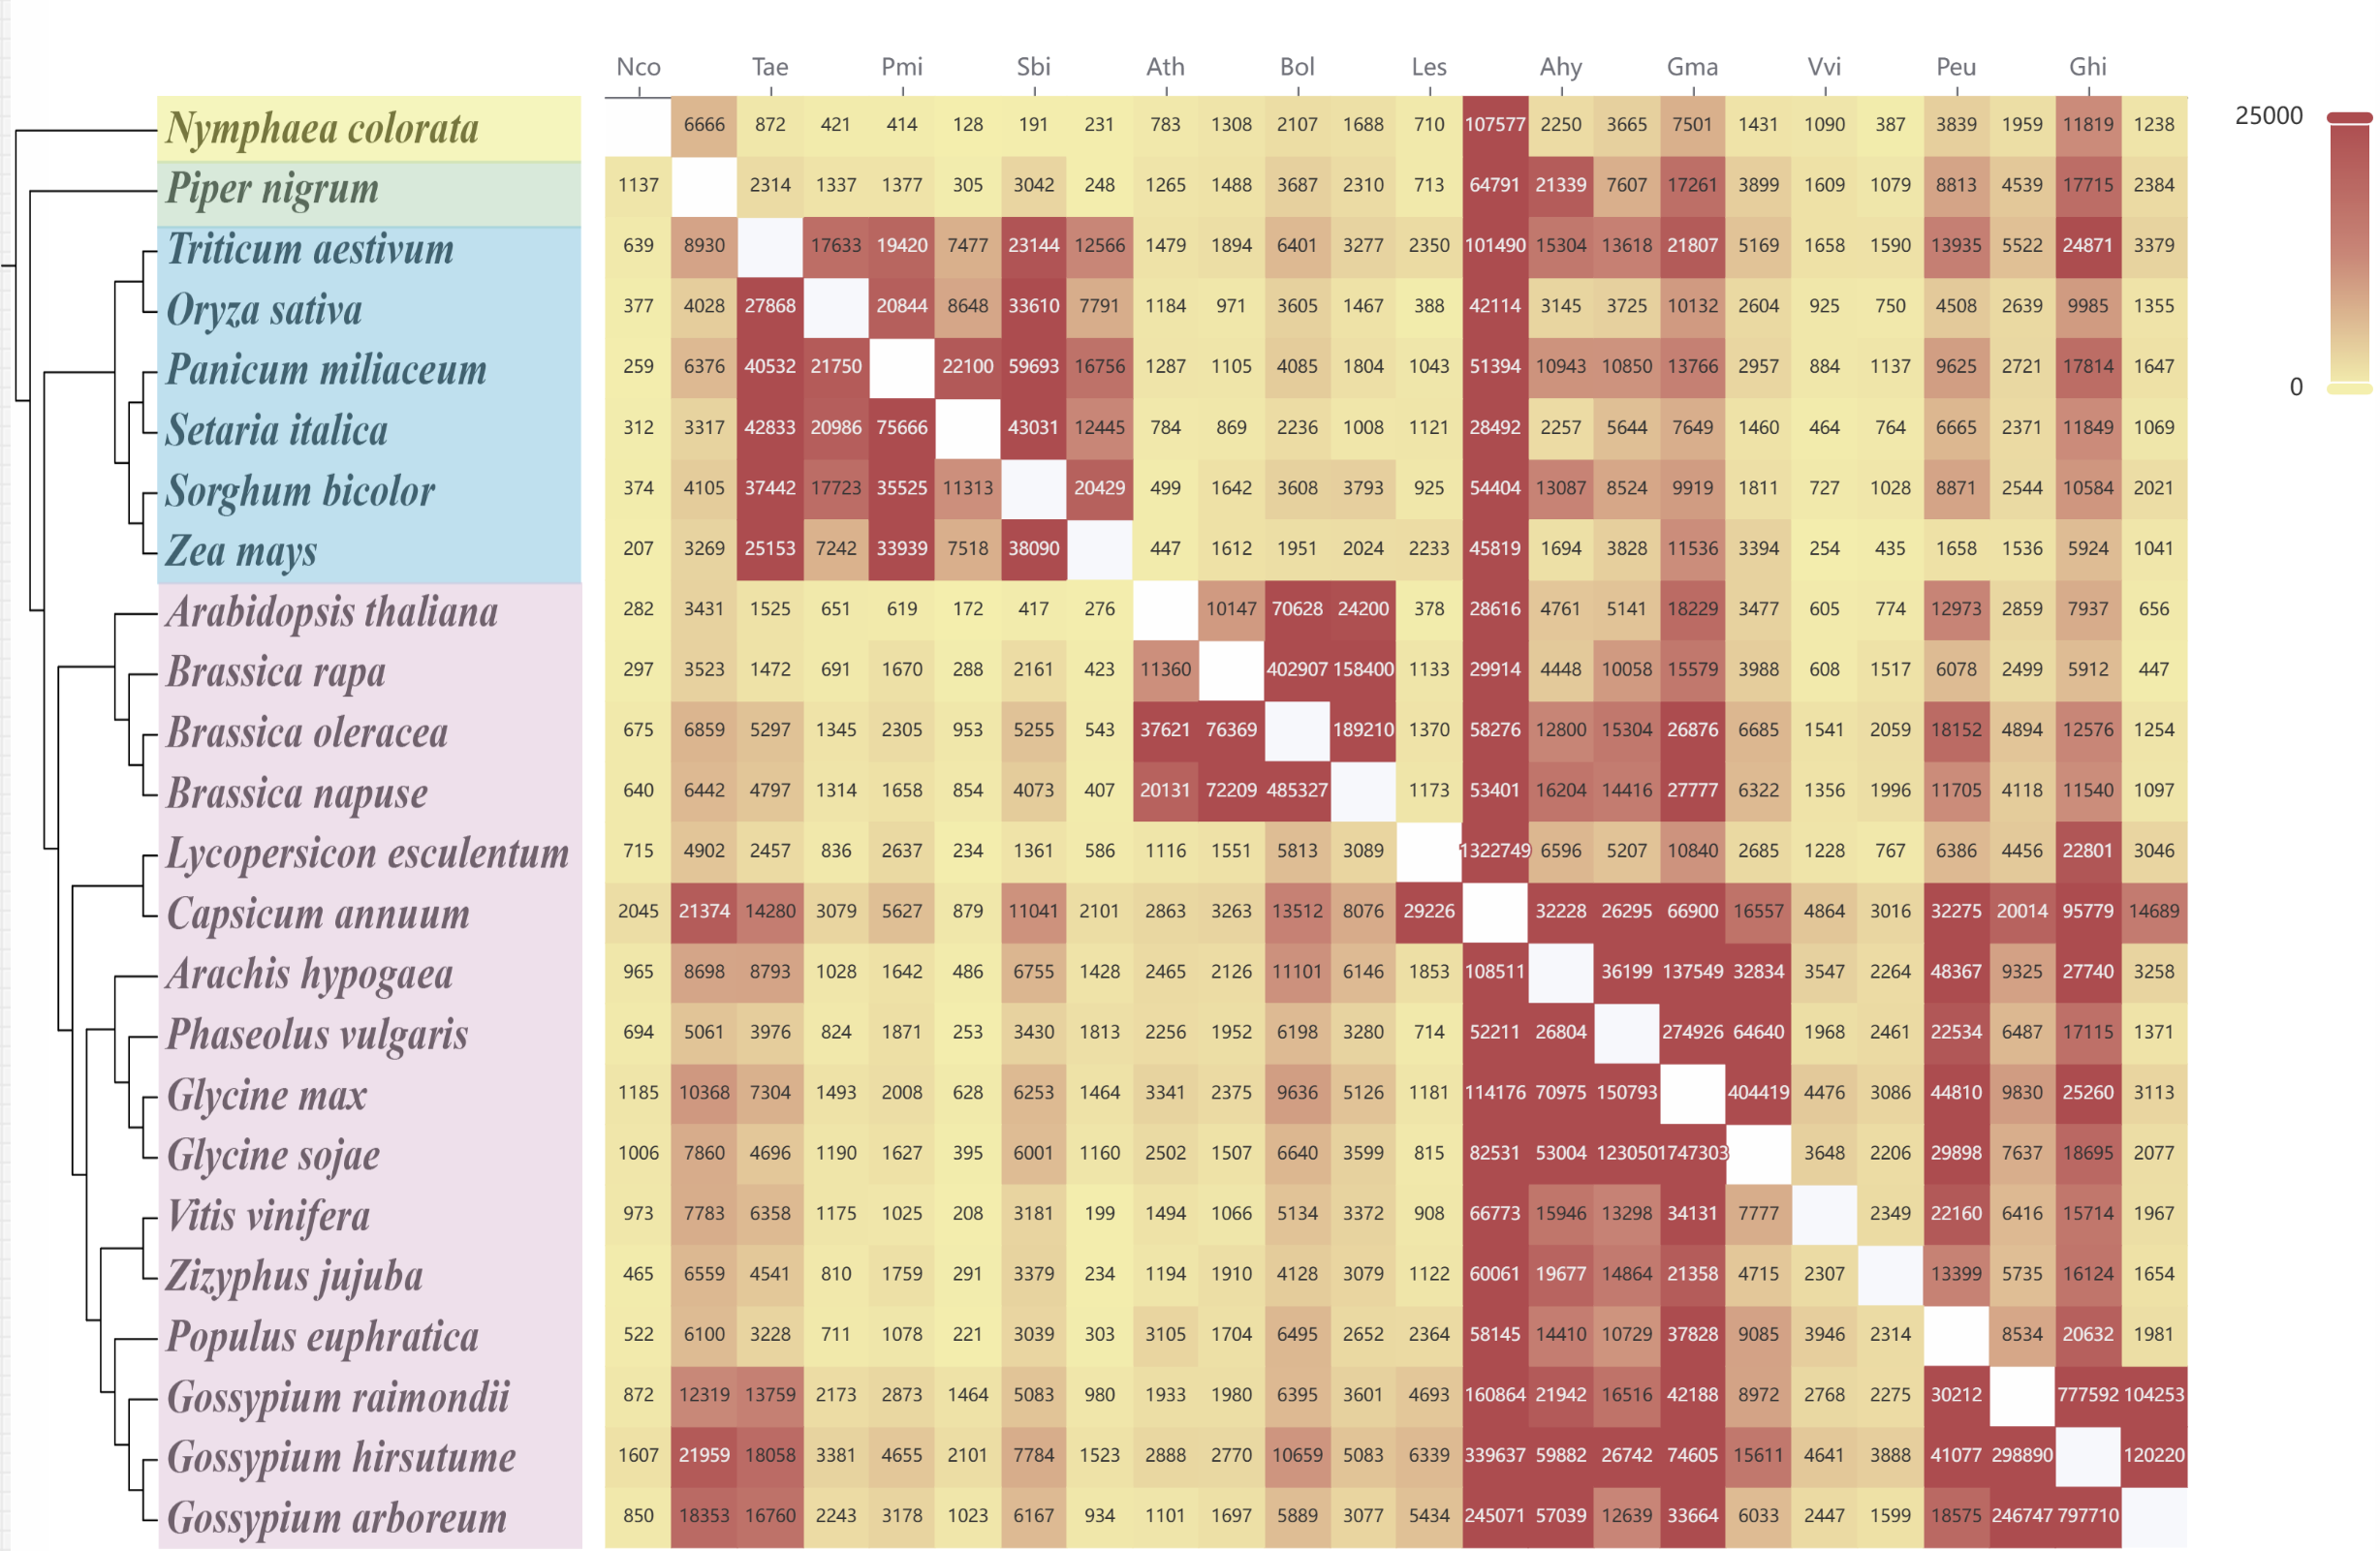
This page allows users to compare Loop structures between different species. By clicking on the numerical labels in the heatmap (representing the number of conserved Loops), users are redirected to a detailed comparison page that displays the Loop alignment and conservation between the selected species.
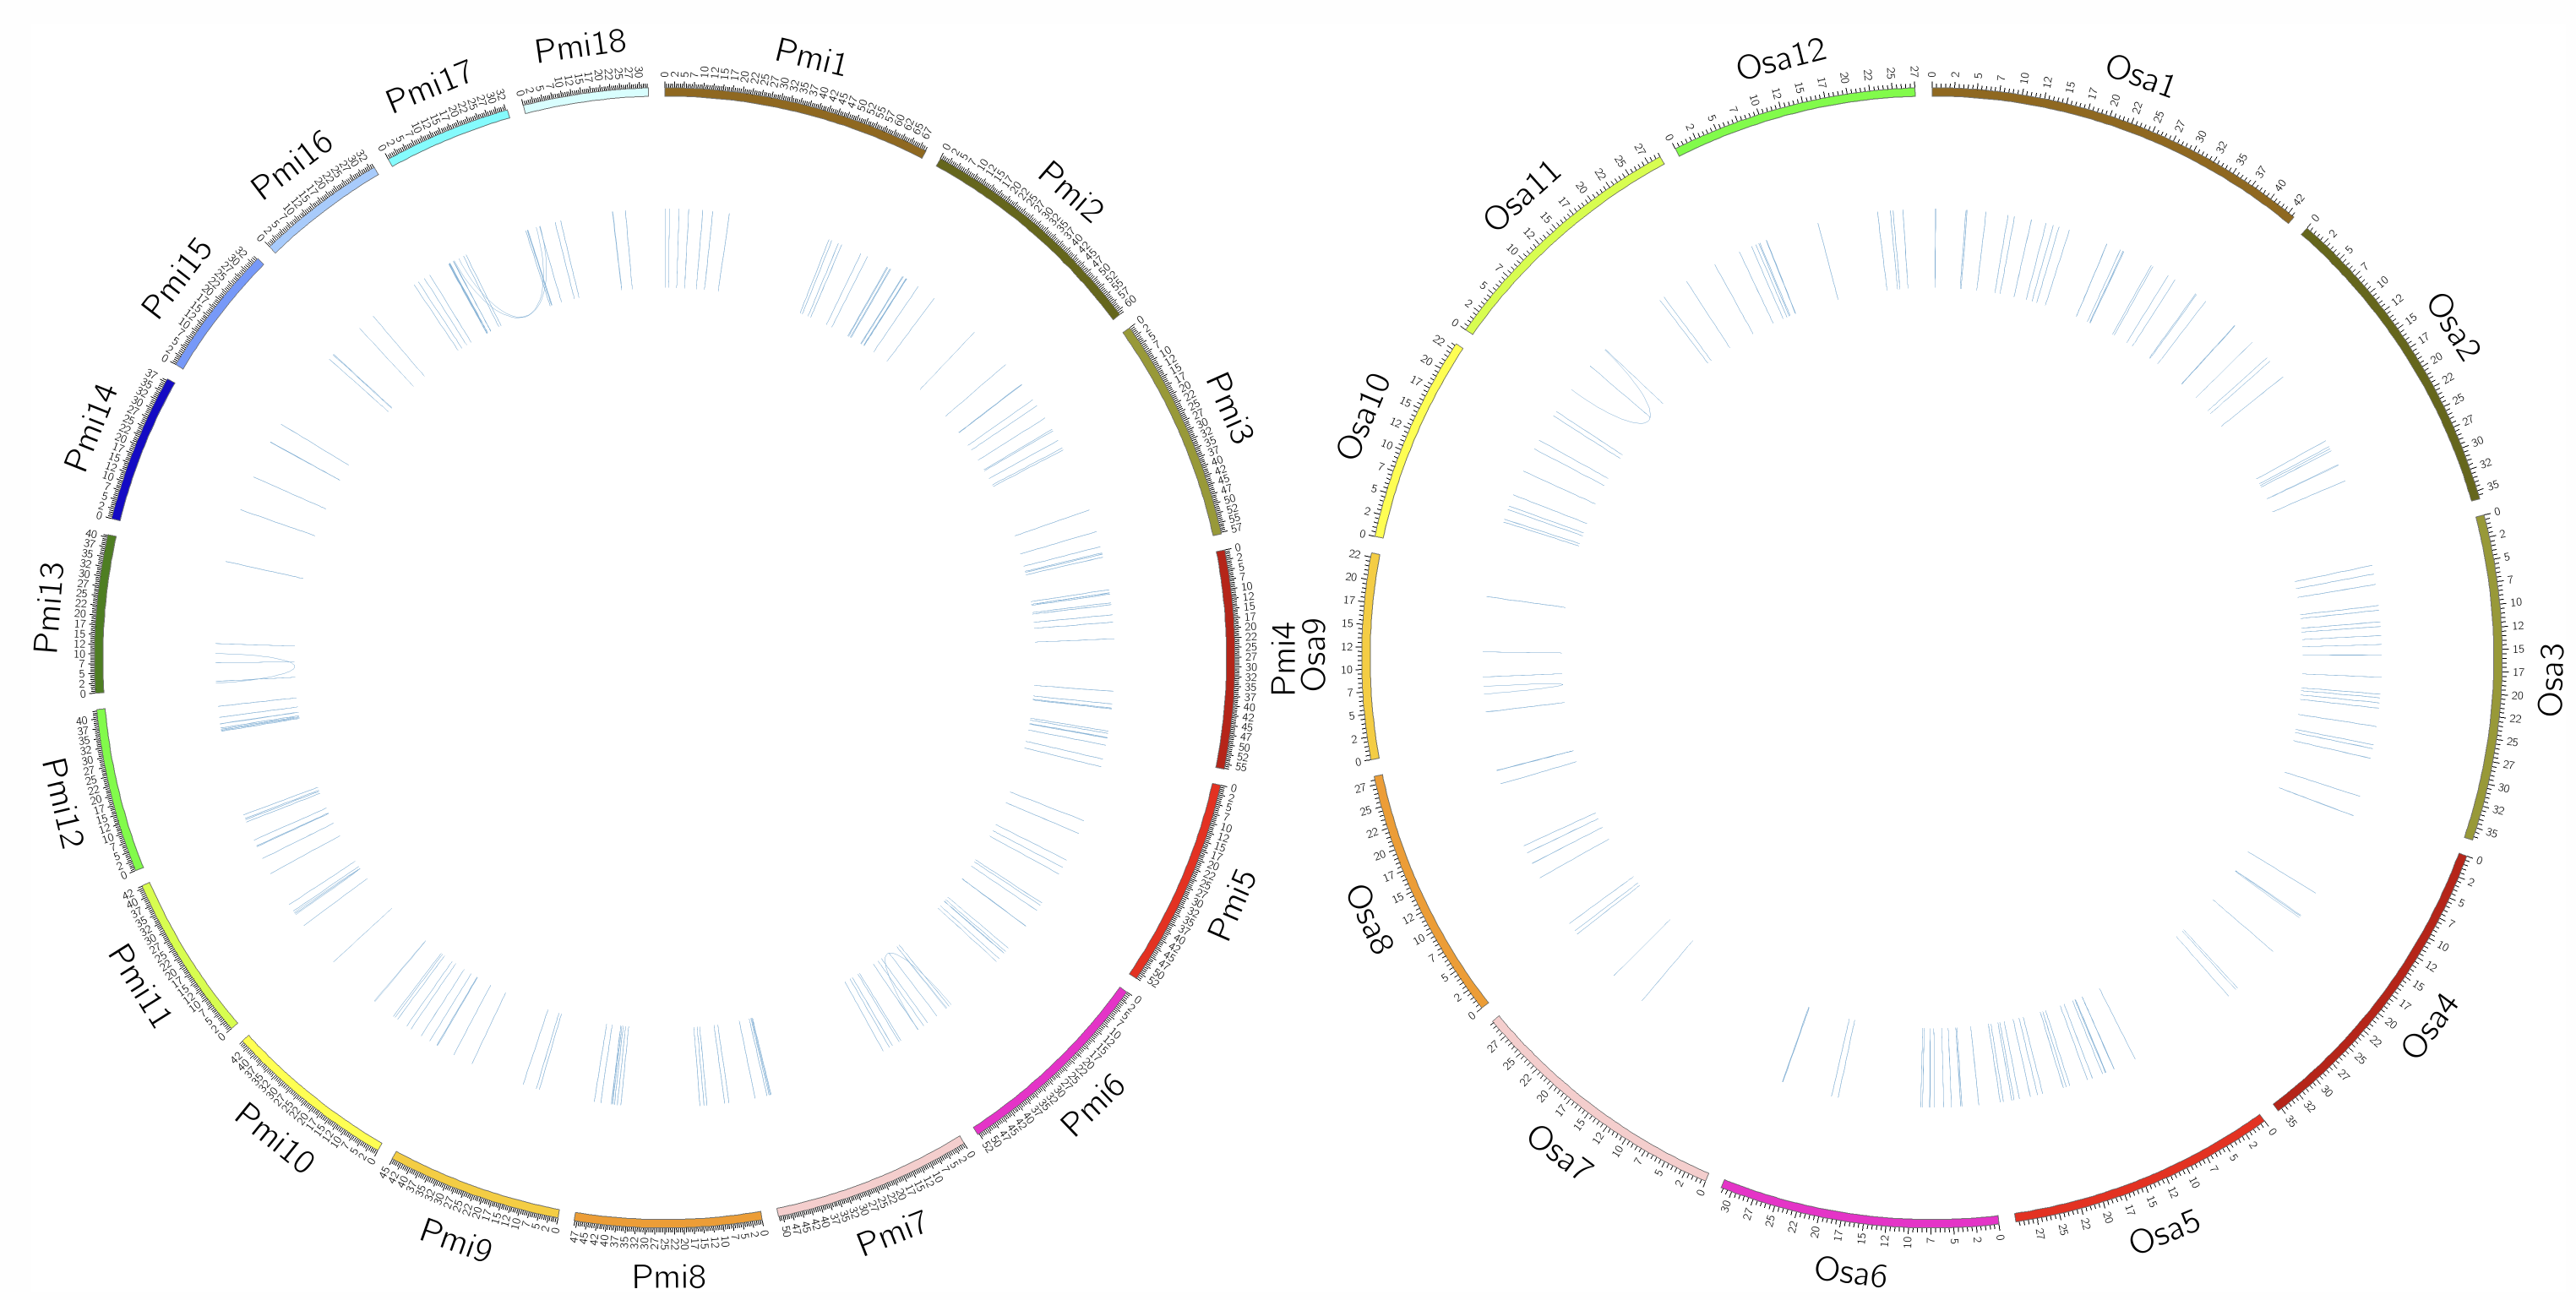
This page visualizes conserved Loop structures between two species using a circular plot. The circular plot shows each species’ conserved Loop structures, with links representing conserved loops within each species. This visualization helps identify evolutionary conservation and structural similarities of chromatin loops between species.
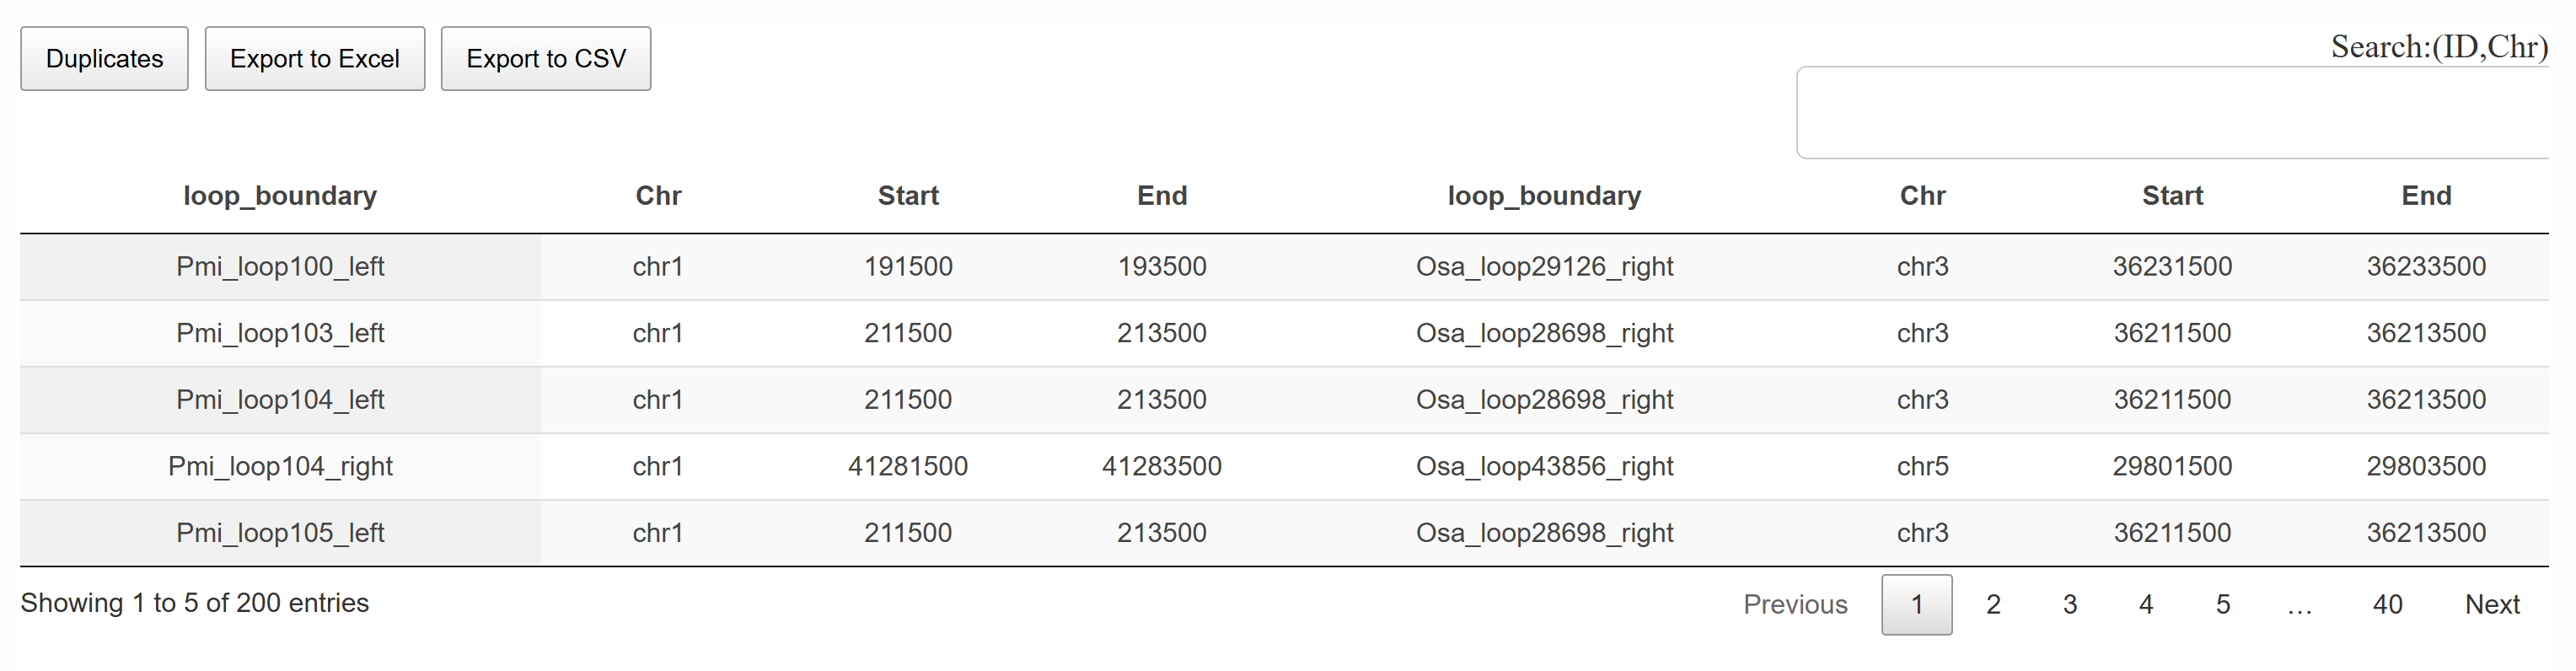
This page provides a comprehensive table of conserved loops between two species. The table lists conserved loop pairs, including chromosomal coordinates and conservation scores. Users can search and filter the table for specific loops of interest. The entire table or filtered results can be downloaded in CSV format for further analysis.
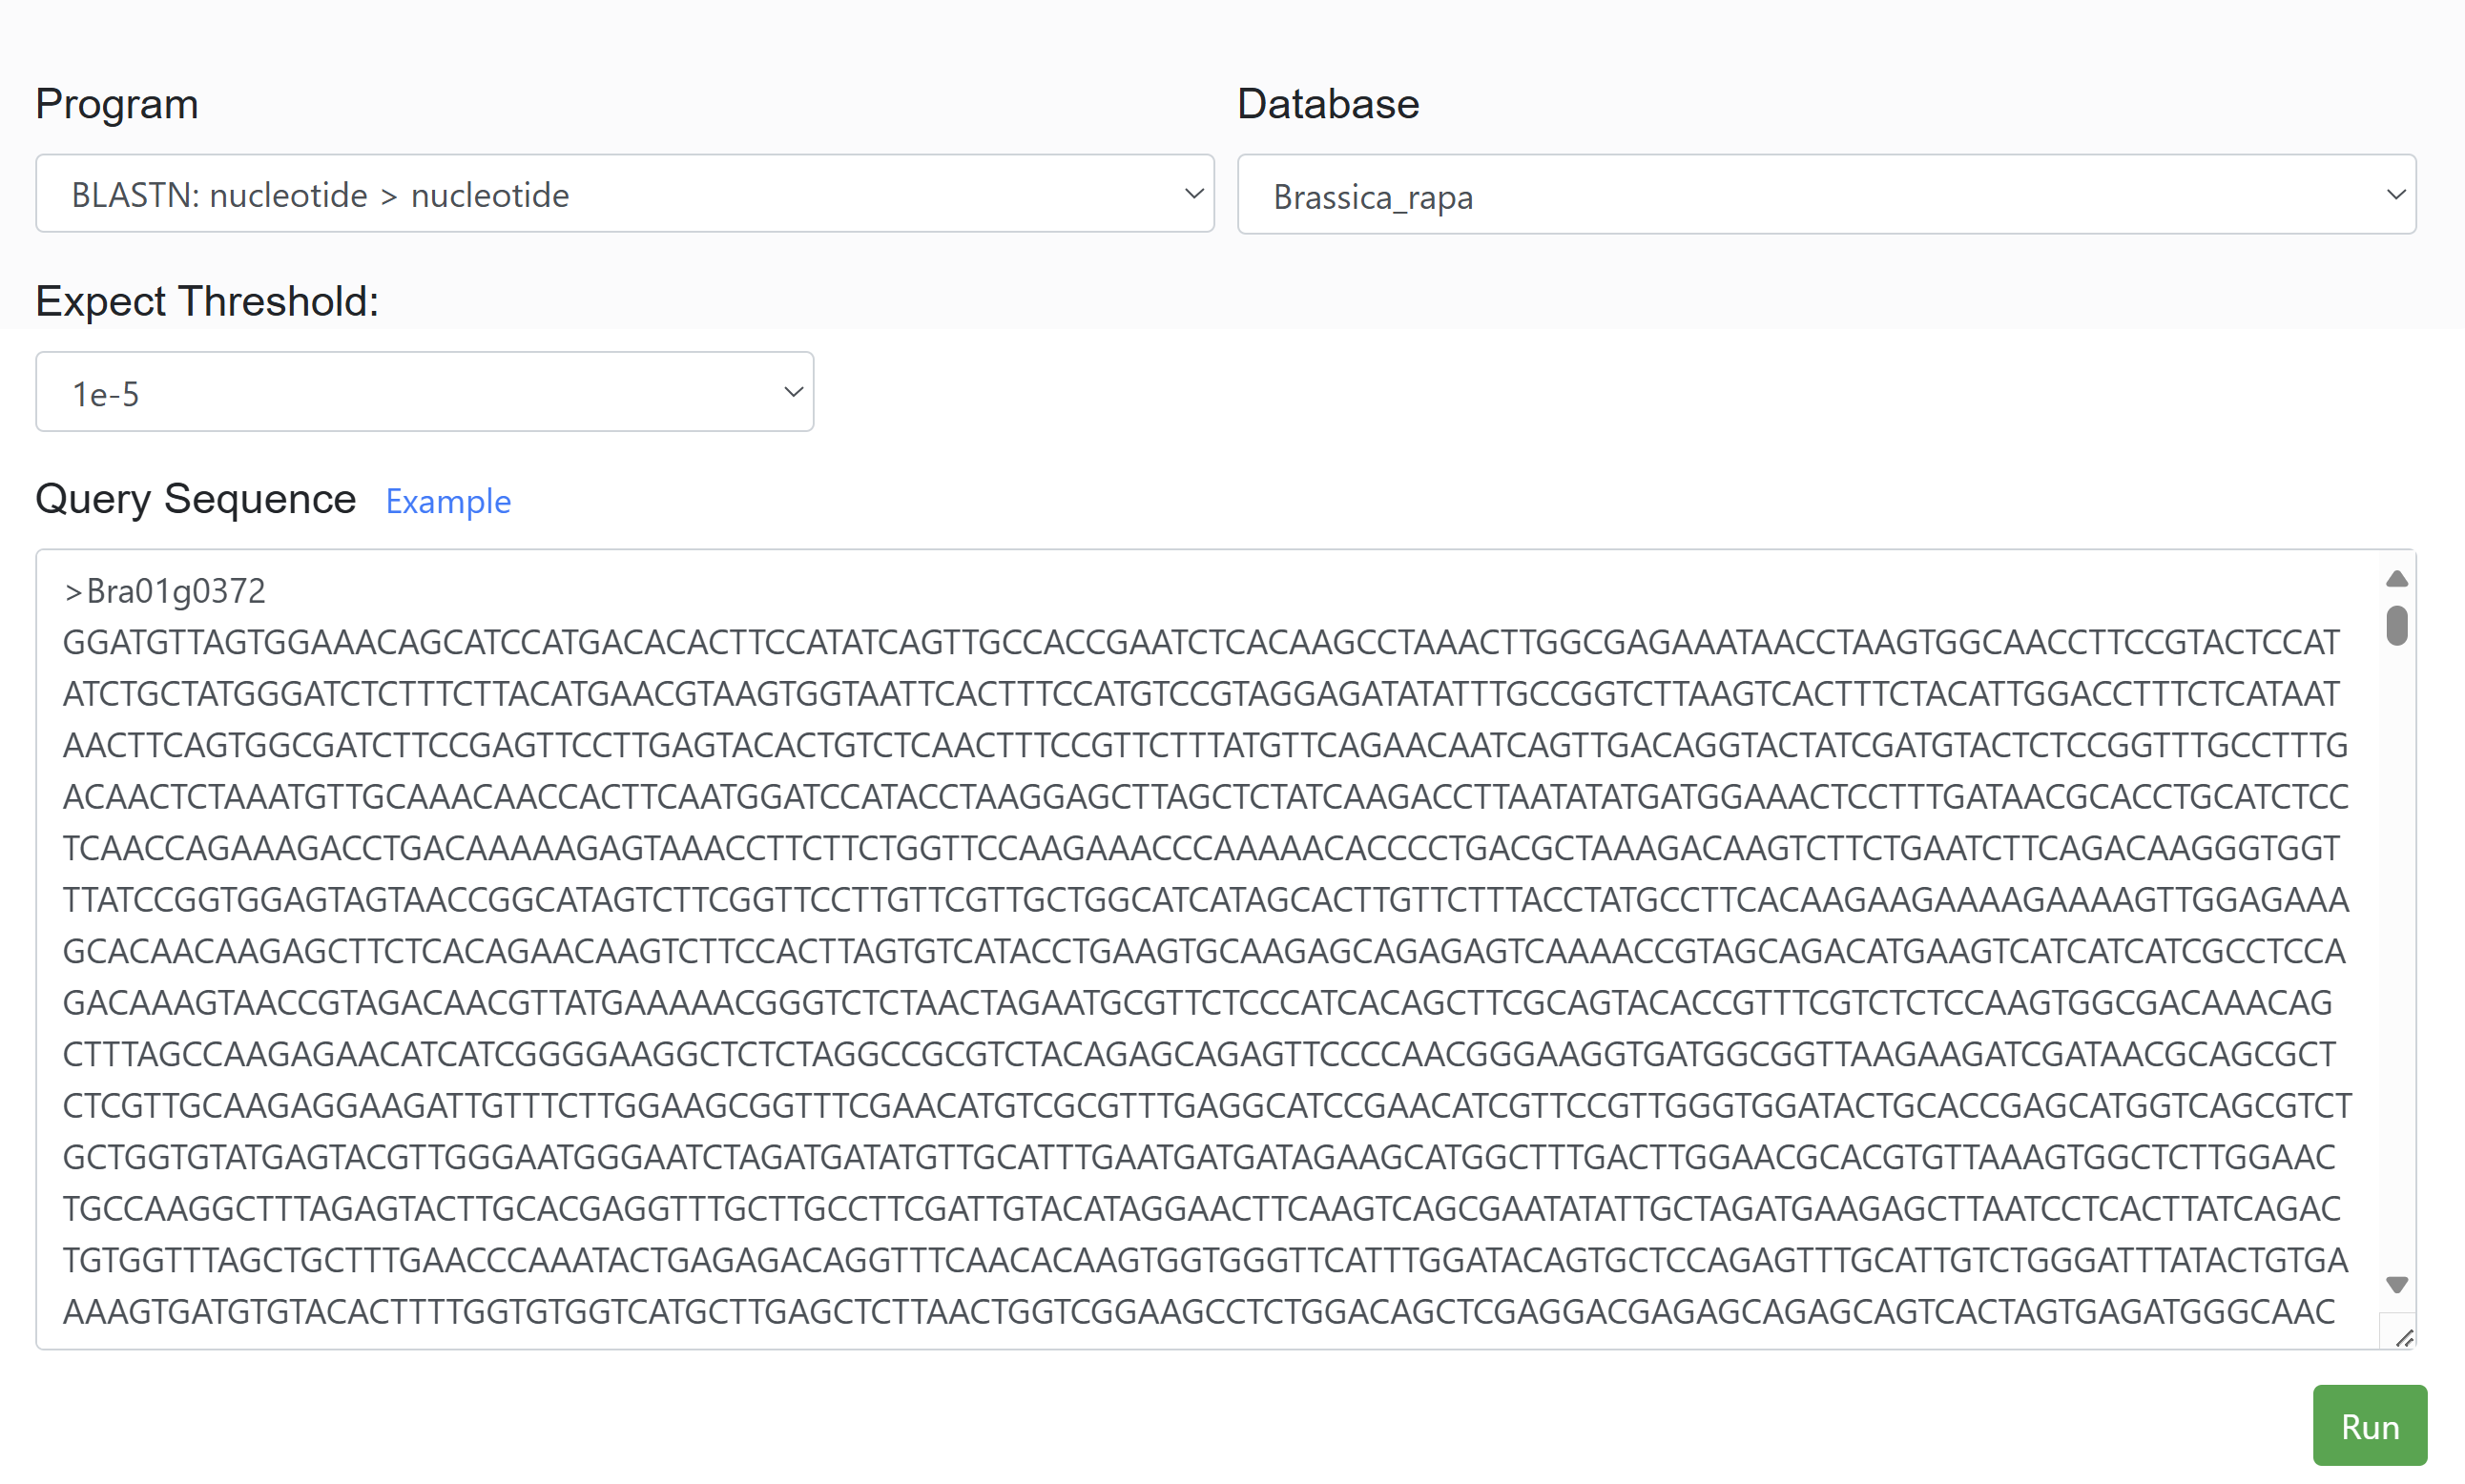
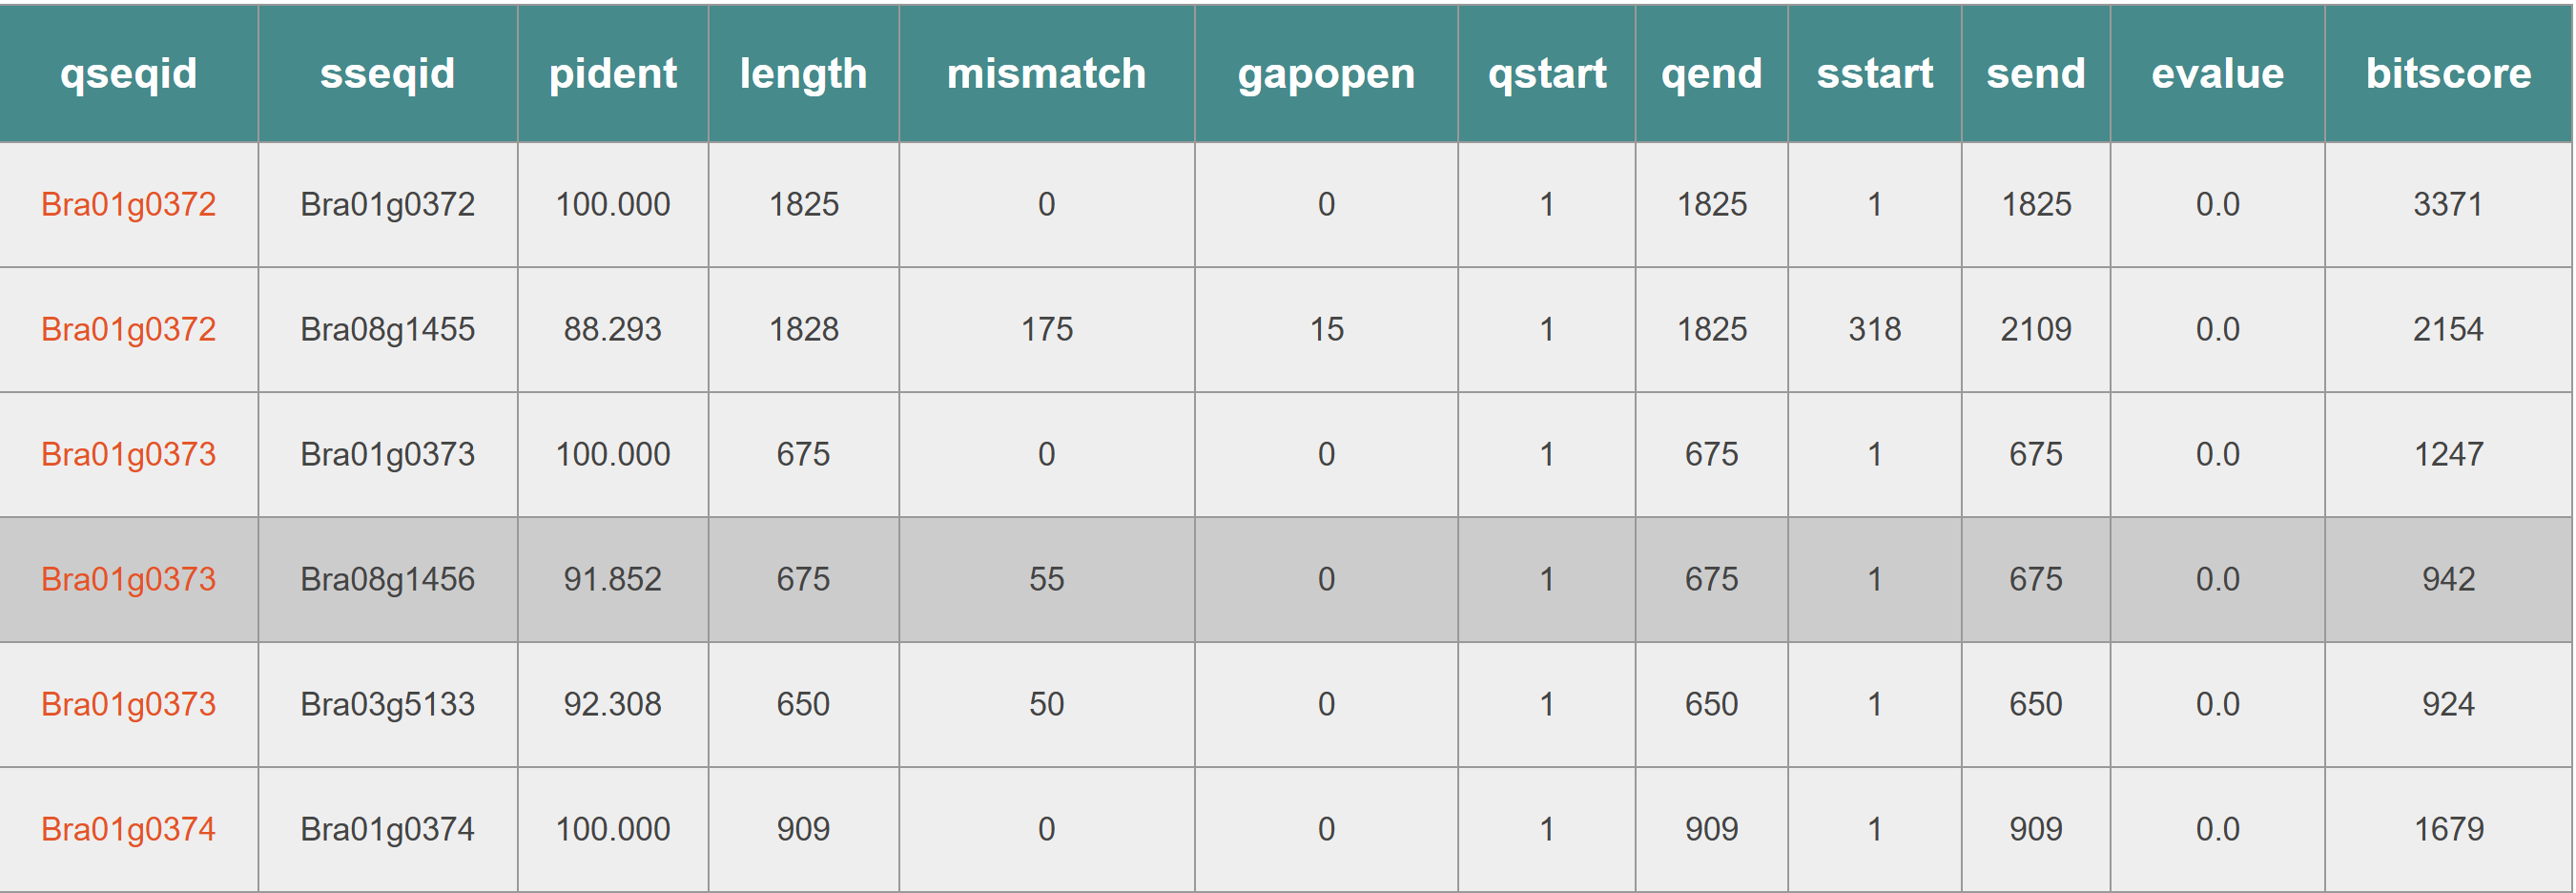
This feature allows users to submit their own sequences and perform BLAST searches against selected species. The tool identifies the location of the submitted sequences within the TAD structures of the chosen species, providing insights into sequence conservation and spatial genomic organization.
The search results display the TADs matched with the input sequence. Match: The number of genes within the TAD that are aligned with the input sequence. Mismatch: The number of genes within the TAD that are not aligned with the input sequence. This information helps users assess the conservation and localization of the input sequence within the selected species' TAD structures.
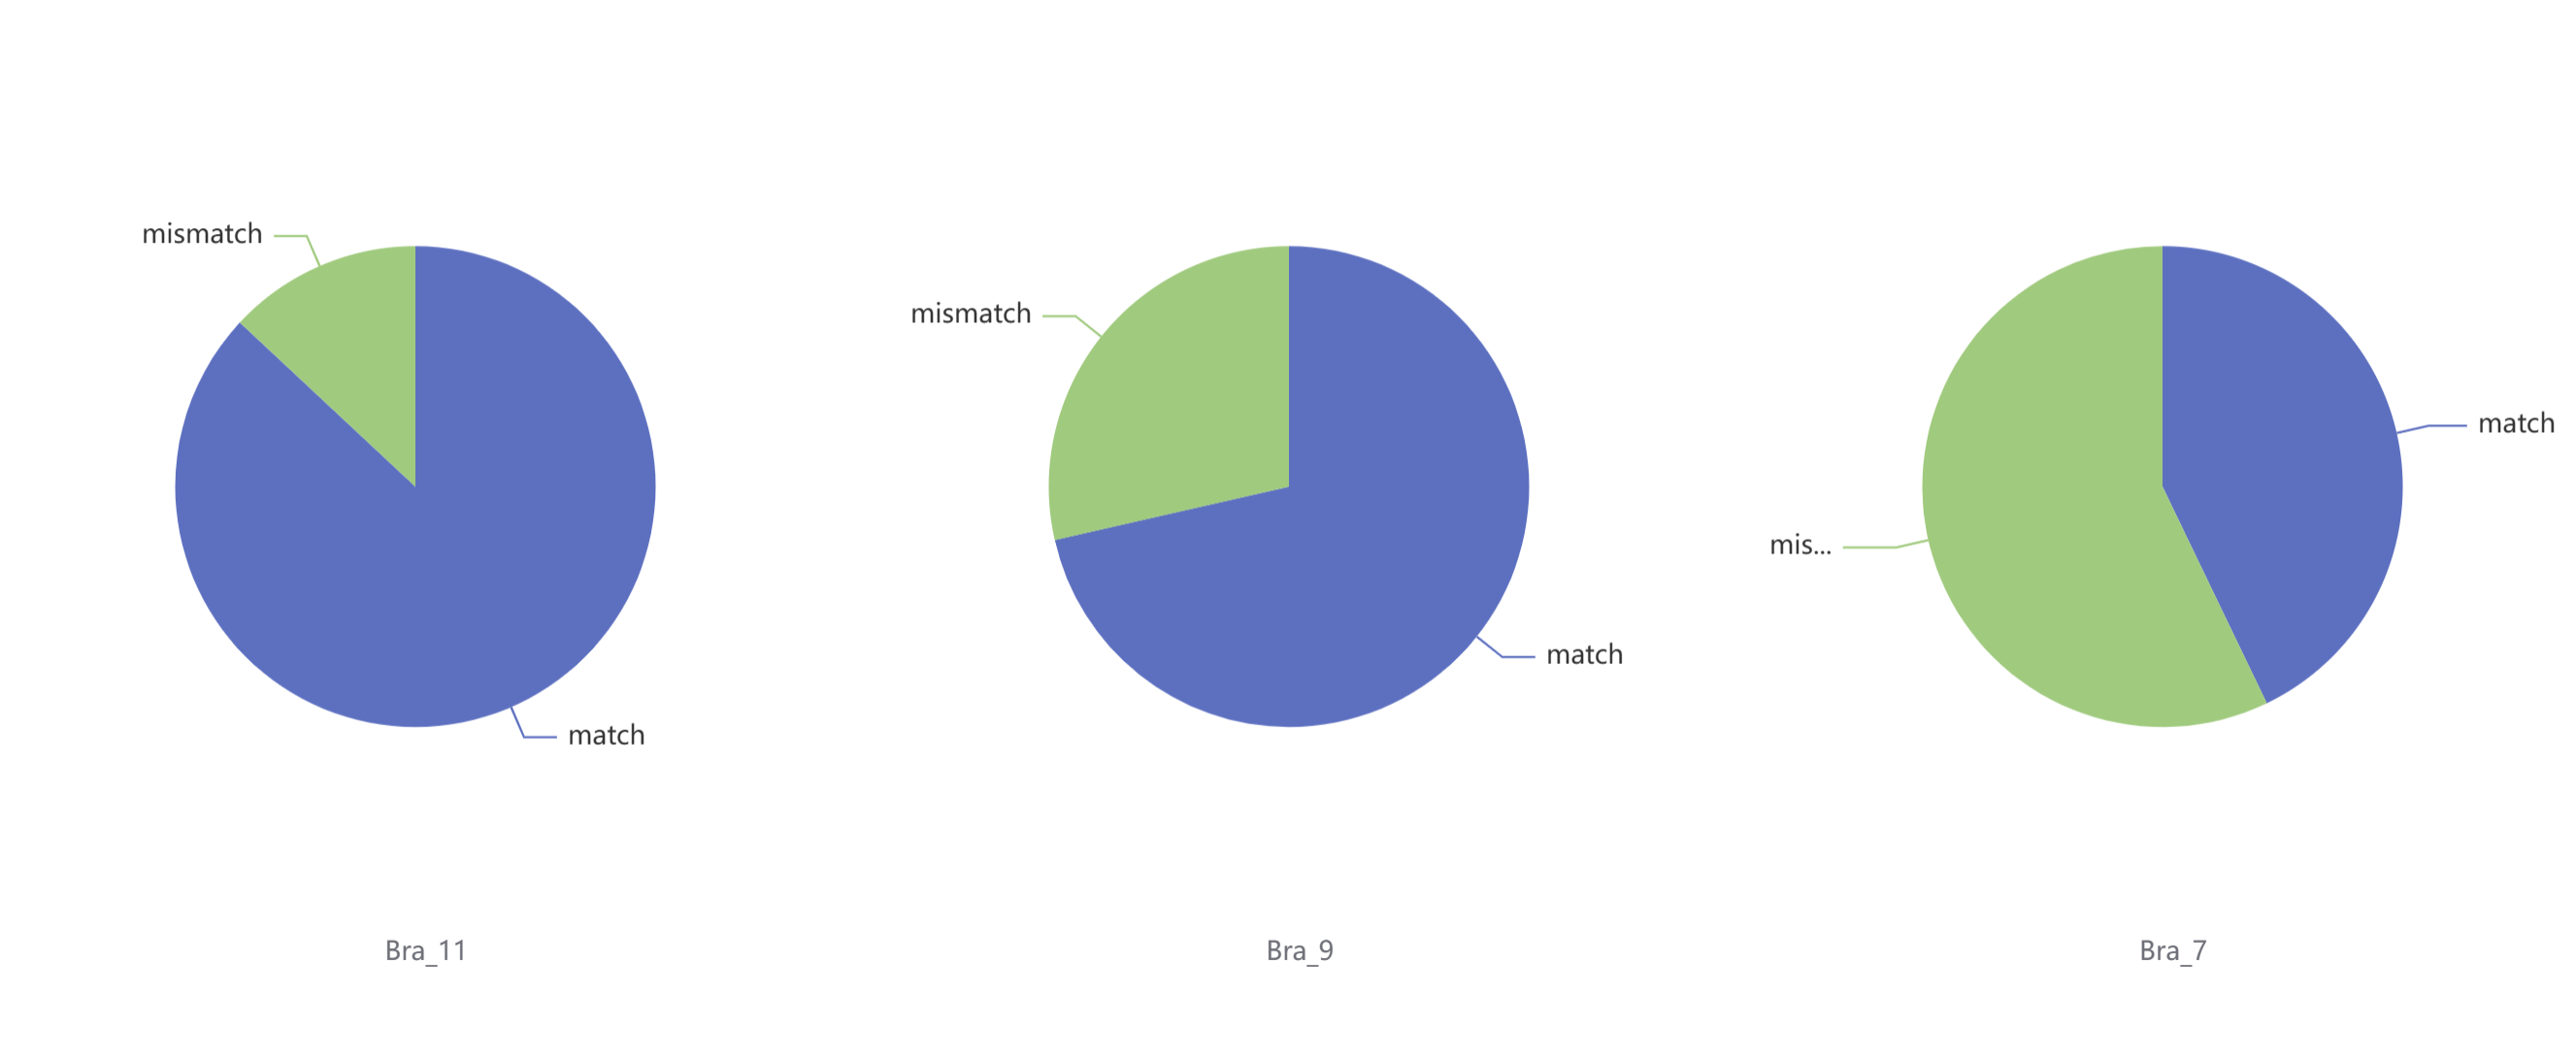
The search results display the TADs matched with the input sequence. Match: The number of genes within the TAD that are aligned with the input sequence. Mismatch: The number of genes within the TAD that are not aligned with the input sequence. This information helps users assess the conservation and localization of the input sequence within the selected species' TAD structures.
Email: mawi0720@163.com
Working Hours:Mon - Fri: 8:00 am to 10:30 pm